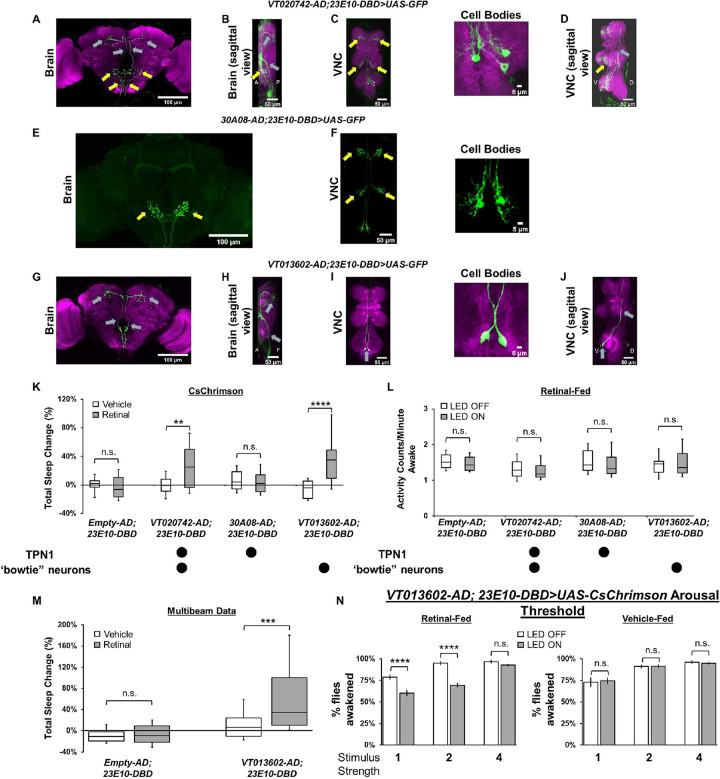
Fig 2. The 23E10-GAL4 driver contains sleep-promoting neurons that are located in the VNC.
(A-D) Representative confocal stacks of a female VT020742-AD; 23E10-DBD>UAS-GFP brain (A), brain sagittal view (B), VNC (C), and VNC sagittal view (D). The cell bodies panel in (C) is a magnified view of the metathoracic area of the VNC. Yellow arrows indicate TPN1-like processes and gray arrows “bowtie” processes. Green, anti-GFP; magenta, anti-nc82 (neuropile marker). A = anterior, P = posterior, V = ventral, and D = dorsal. (E, F) Representative confocal stacks of a female 30A08-AD; 23E10-DBD>UAS-GFP brain (E) and VNC (F). The cell bodies panel in (F) is a magnified view of the metathoracic area of the VNC. Yellow arrows indicate TPN1 processes in the brain and VNC. Green, anti-GFP. (G–J) Representative confocal stacks of a female VT013602-AD; 23E10-DBD>UAS-GFP brain (G), brain sagittal view (H), VNC (I), and VNC sagittal view (J). The cell bodies panel in (I) is a magnified view of the metathoracic area of the VNC. Gray arrows indicate “bowtie” processes and cell bodies in (I) and (J). Green, anti-GFP; magenta, anti-nc82 (neuropile marker). A = anterior, P = posterior, V = ventral, and D = dorsal. (K) Box plots of total sleep change in % for control (Empty-AD; 23E10-DBD>UAS-CsChrimson), VT020742-AD; 23E10-DBD>UAS-CsChrimson, 30A08-AD; 23E10-DBD>UAS-CsChrimson and VT013602-AD; 23E10-DBD>UAS-CsChrimson vehicle-fed and retinal-fed female flies upon 627-nm LED stimulation. Two-way ANOVA followed by Sidak’s multiple comparisons revealed that retinal-fed VT020742-AD; 23E10-DBD>UAS-CsChrimson and VT013602-AD; 23E10-DBD>UAS-CsChrimson flies increase sleep significantly when stimulated with 627-nm LEDs when compared with vehicle-fed flies. **P < 0.01, ****P < 0.0001, n.s. = not significant, n = 13–34 flies per genotype and condition. (L) Box plots of locomotor activity counts per minute awake for retinal-fed flies presented in (K). Two-way repeated measures ANOVA followed by Sidak’s multiple comparisons test show that locomotor activity per awake time is not affected when the flies are stimulated with 627-nm LEDs, n.s. = not significant, n = 15–34 flies per genotype. (M) Box plots of total sleep change in % for control (Empty-AD; 23E10-DBD>UAS-CsChrimson) and VT013602-AD; 23E10-DBD>UAS-CsChrimson vehicle-fed and retinal-fed female flies upon 627-nm LED stimulation measured with the multibeam MB5 system. Two-way ANOVA followed by Sidak’s multiple comparisons revealed that retinal-fed VT013602-AD; 23E10-DBD>UAS-CsChrimson flies increase sleep significantly when stimulated with 627-nm LEDs when compared with vehicle-fed flies. ***P < 0.001, n.s. = not significant, n = 19–24 flies per genotype and condition. (N) Arousal threshold in vehicle-fed and retinal-fed VT013602-AD; 23E10-DBD>UAS-CsChrimson female flies. Percentage of flies awakened by a stimulus of increasing strength (1, 2, and 4 downward movements in the SNAP apparatus) with and without 627-nm LEDs stimulation. Two-way ANOVA followed by Sidak’s multiple comparisons indicates that in retinal-fed flies activation of VT013602-AD; 23E10-DBD neurons reduce the responsiveness to the 1 and 2 stimulus strength when compared with non-activated flies. No difference in responsiveness is seen at the strongest stimulus (4). Two-way ANOVA followed by Sidak’s multiple comparisons indicates that in vehicle-fed flies, no difference in responsiveness is seen between LED stimulated and non-stimulated flies. ****P < 0.0001, n.s. = not significant, n = 16 flies per genotype and condition. The raw data underlying parts (K–N) can be found in S1 Data. SNAP, sleep-nullifying apparatus; TPN1, taste projection neurons 1; VNC, ventral nerve cord.

