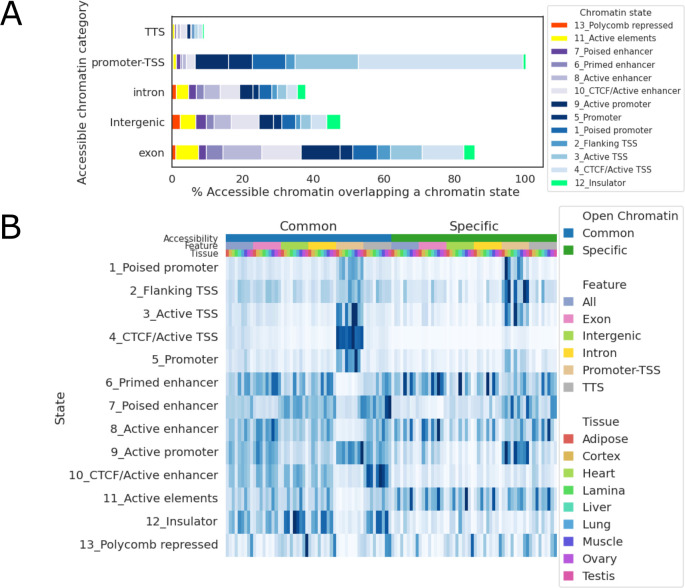
Fig 8. Chromatin accessibility across states.
(A) Percentage of open chromatin peaks that overlap each chromatin state. (B) Heatmap of enrichment for each state around open chromatin peaks. The top three color bars denote shared or tissue-specific open chromatin, open chromatin annotation, and tissues, respectively. Enrichment scores were normalized in each column.

