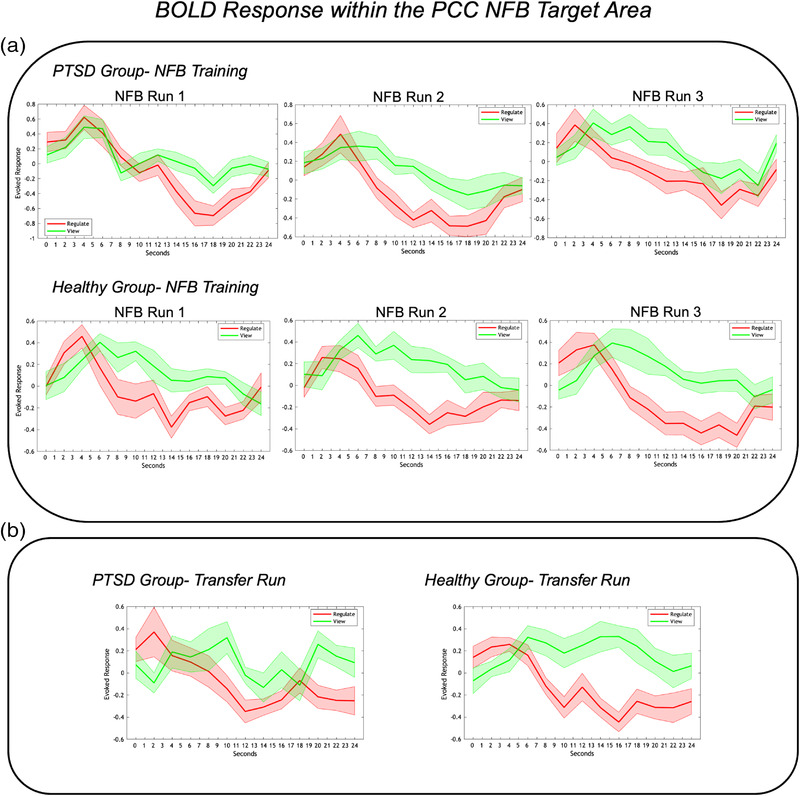
FIGURE 2.

(a) Event‐related BOLD activation within the neurofeedback target area (PCC) for the PTSD and healthy control groups during the three neurofeedback training runs. The red and green lines indicate PCC activation during the regulate and view conditions, respectively. As shown, both the PTSD and healthy control groups showed significantly lower PCC activation during regulate as compared to view conditions for all three neurofeedback training runs. (b) Event‐related BOLD activation within the neurofeedback target area (PCC) for the PTSD and healthy control groups during the transfer run. As with the training runs, both groups showed significantly lower PCC activation during regulate as compared to view conditions during the transfer run. The x‐axis of the graphs indicate time over the 24 s conditions; the y‐axis indicates the event‐related BOLD response (peristimulus time histogram) in the neurofeedback target area (PCC). Shaded areas adjacent to the red and green lines indicate standard error of the mean. PCC = posterior cingulate cortex, NFB = Neurofeedback. Figure reproduced with permission from Nicholson et al. (2021).
