Fig. 3.

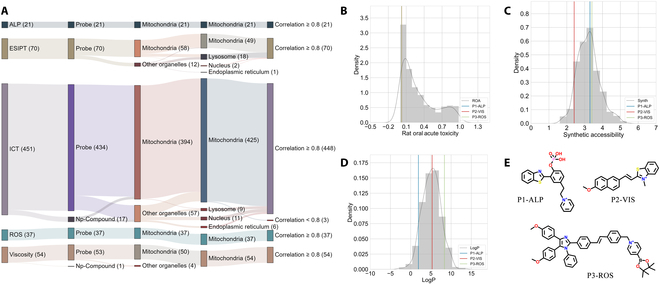
The prediction results of the designed probes by our multilevel framework. (A) The Sankey diagram displayed the predicted categories and the relationship between different models for ESIPT, ICT, ALP, ROS, and Viscosity sets. (B to D) The distribution of the important properties (rat oral acute toxicity, synthetic accessibility, and logP) for P1-ALP, P2-VIS, and P3-ROS compared with all designed probes. Here, rat oral acute toxicity represents the probability of a compound being of high toxicity; synthetic accessibility estimates the ease of synthesis of drug-like molecules, from 1 (very easy) to 10 (very difficult); logP represents the logarithm of the n-octanol/water distribution coefficient. The value of 3 was usually used as a threshold, and a higher one means high lipophilicity. (E) The molecular structures of P1-ALP, P2-VIS, and P3-ROS.
