Fig. 3.

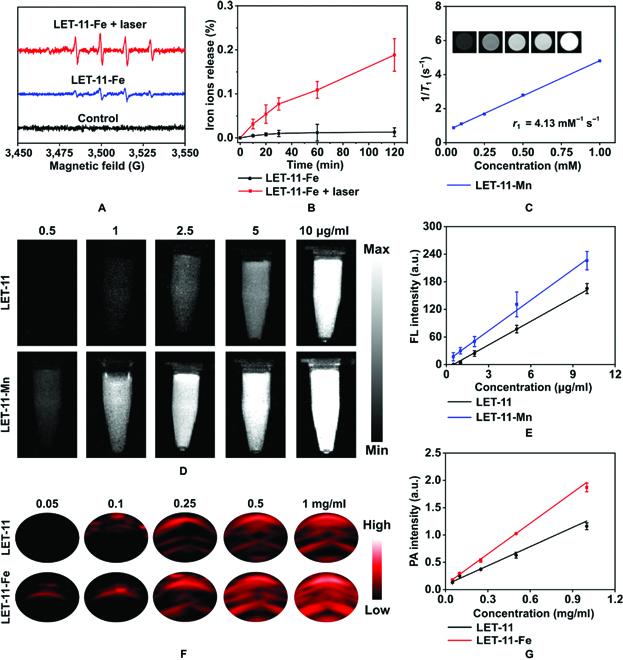
Trimodality imaging in vitro. (A) ESR spectra of LET-11-Fe solution incubated with H2O2 and DMPO with or without laser irradiation. (B) Release profiles of iron ions from LET-11-Fe with or without laser irradiation (n = 3). (C) Plots of T1−1 versus Mn concentration for LET-11-Mn and T1-weighted MRI images (inset). (D) Fluorescence images of LET-11 and LET-11-Mn at different concentrations (excitation, 808 nm; 1,000-nm long-pass emission filter). (E) Fluorescence intensity as a function of LET-11 and LET-11-Mn at different concentrations. (F) PA images of LET-11 and LET-11-Fe under excitation at 835 nm at different concentrations. (G) PA835 intensity as a function of LET-11 and LET-11-Fe at different concentrations.
