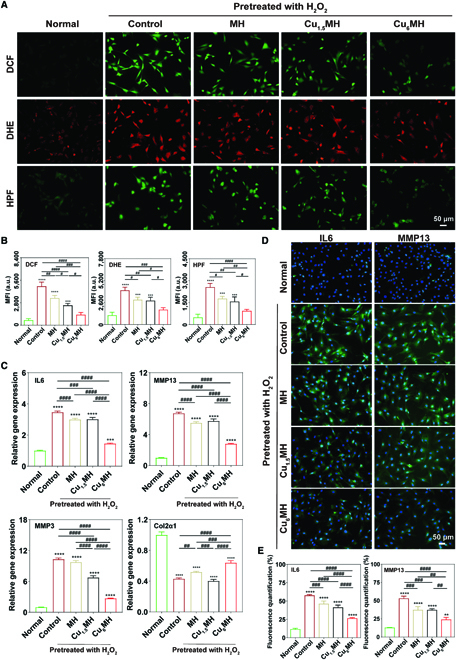
Fig. 5.

Antioxidant and anti-inflammatory capacity in cellular levels. (A) Intracellular ROS levels of H2O2 (400 μM, 30 min)-induced chondrocytes after incubation by fluorescent microscopy: total ROS levels (DCF), ·O2− (DHE), and ·OH (HPF), and the corresponding quantification of mean fluorescent intensity (MFI) (B). (C) Genes (IL6, MMP13, MMP3, and Col2α1) expression of H2O2 (400 μM, 30 min)-induced chondrocytes after incubation by qRT-PCR. (D) Immunofluorescent images of IL6 and MMP13 expression of H2O2 (400 μM, 30 min)-induced chondrocytes after incubation by fluorescent microscopy and the corresponding quantification (E). The samples were normal chondrocytes (Normal), H2O2-induced chondrocytes (Control), and H2O2-induced chondrocytes after incubating with 20 μg/ml MH, Cu1.5MH and Cu6MH, respectively. (“*” symbol compared with normal group, **P < 0.01, ***P < 0.001, and ****P < 0.0001, and “#” symbol compared between groups, #P < 0.05, ##P < 0.01, ###P < 0.001, and ####P < 0.0001).
