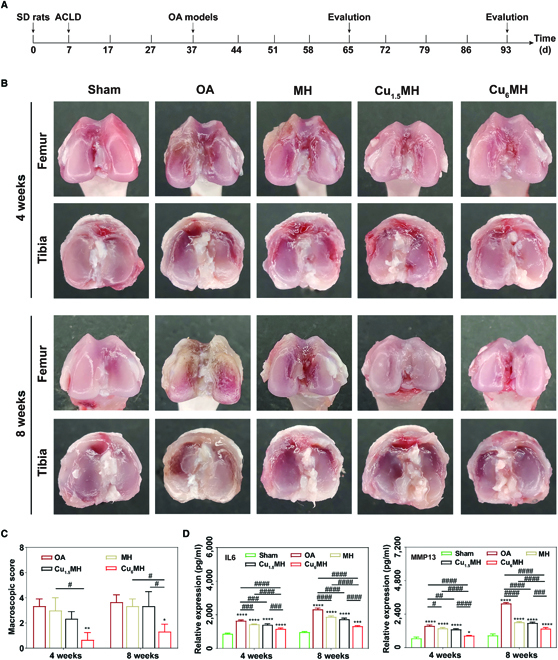
Fig. 7.

In vivo OA therapy effect. (A) Time schedule of in vivo experimental design. (B) Macroscopic observation of OA joints after IA injection at 4 and 8 weeks and their corresponding macroscopic scoring (C) (“*” symbol compared with OA group, *P < 0.05, **P < 0.01, and “#” symbol compared between groups, #P < 0.05). (D) IL6 and MMP13 expression of joint fluid by ELISA. The corresponding groups were as follows: normal rats (Sham), OA rats by PBS treatment (OA), OA rats by MH treatment (MH), OA rats by Cu1.5MH treatment (Cu1.5MH), and OA rats by Cu6MH treatment (Cu6MH), respectively. (“*” symbol compared with sham group, *P < 0.05, **P < 0.01, ***P < 0.001, and ****P < 0.0001, and “#” symbol compared between groups, #P < 0.05, ##P < 0.01, ###P < 0.001, and ####P < 0.0001) ACLD, anterior cruciate ligament-deficient.
