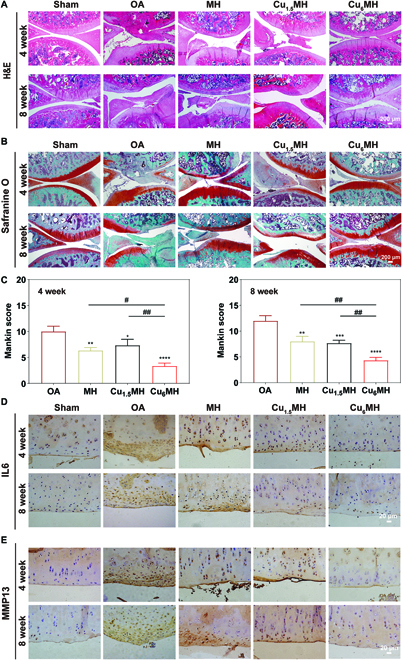
Fig. 8.

Histological evaluation of OA therapy. (A) H&E staining images of OA joints after therapy. (B) Safranine O-fast green staining images of OA joints after therapy and the corresponding Mankin scoring at 4 and 8 weeks (C). Immunohistochemical staining results of OA joints after treatment: IL6 (D) and MMP13 (E). The corresponding groups were as follows: normal rats (Sham), OA rats by PBS treatment (OA), OA rats by MH treatment (MH), OA rats by Cu1.5MH treatment (Cu1.5MH), and OA rats by Cu6MH treatment (Cu6MH). (“*” symbol compared with OA group, *P < 0.05, **P < 0.01, ***P < 0.001 and ****P < 0.0001, and “#” symbol compared between groups, #P < 0.05 and ##P < 0.01).
