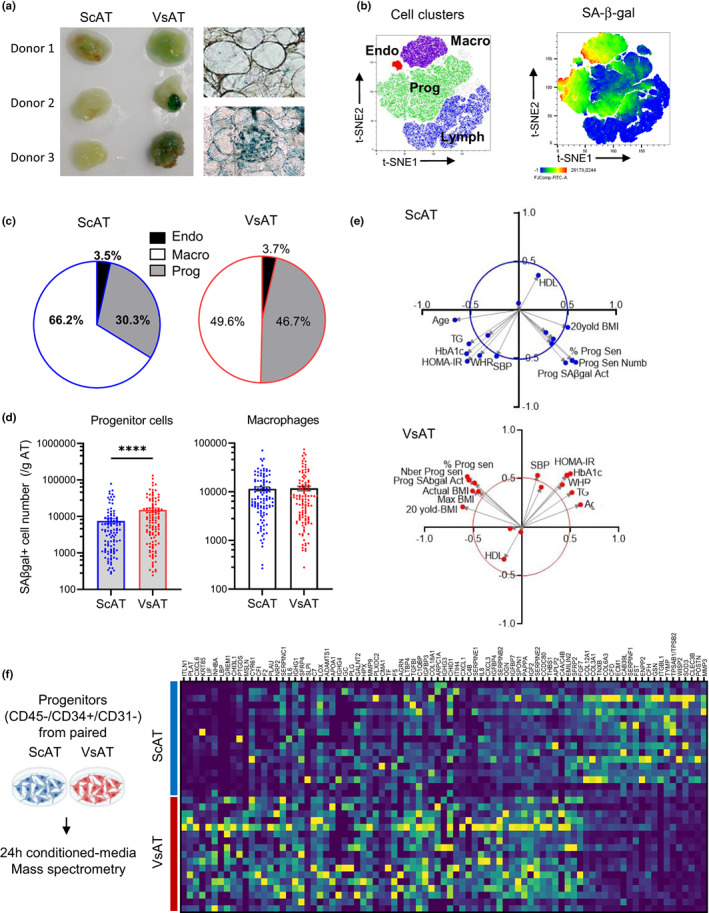
FIGURE 1.

Senescence in progenitor cells defines a fat depot‐specific pattern in obesity. (a) Colorimetric SA‐β‐gal staining on paired biopsies of subcutaneous and visceral adipose tissue (ScAT and VsAT). Representative views of whole AT pieces and light microscope images are shown. (b) Paired ScAT and VsAT stroma‐vascular fraction (SVF) cells from 55 subjects were analyzed by flow cytometry. tSNE of data after downsampling and concatenation enabled the identification of clusters by cell type: purple macrophages (CD45+/CD34−/CD31int/highFSC/HighSSC), red endothelial cells (CD45−/CD34+/CD31+/HighFSC/HighSSC), green progenitor cells (CD45−/CD34+/CD31−/HighFSC/HighSSC), and blue lymphocytes (CD45+/CD34−/CD31−/lowFSC/LowSSC; left panel) and same tSNE colored by SA‐β‐gal fluorescence intensity (right panel). (c) Pie charts showing the percentage of cell types within the SA‐β‐gal‐positive cells in ScAT and VsAT. (d) Supervised analysis of the SA‐β‐gal+ cells, histograms represent means ± sem of SA‐β‐gal+ cells per gram of tissue for progenitor cells (left) and macrophages (right) from ScAT (blue) and VsAT (red; n = 115 donors, two‐way ANOVA, Tukey's post‐test). (e) Principal component analyses performed on clinical and anthropometrical parameters of obese AT donors and ScAT (upper panel, blue) and VsAT (lower panel, red) progenitor senescence variables. (f) Immuno‐selected progenitor cells from paired ScAT and VsAT biopsies of 17 obese subjects were maintained for 24 h in basal medium, and the conditioned media were harvested and analyzed by mass spectrometry. Heatmap of most relevant differentially expressed proteins from the 17 secretomes of ScAT (blue) and VsAT (red) progenitors (deep blue corresponding to the smallest value and yellow to the highest value)
