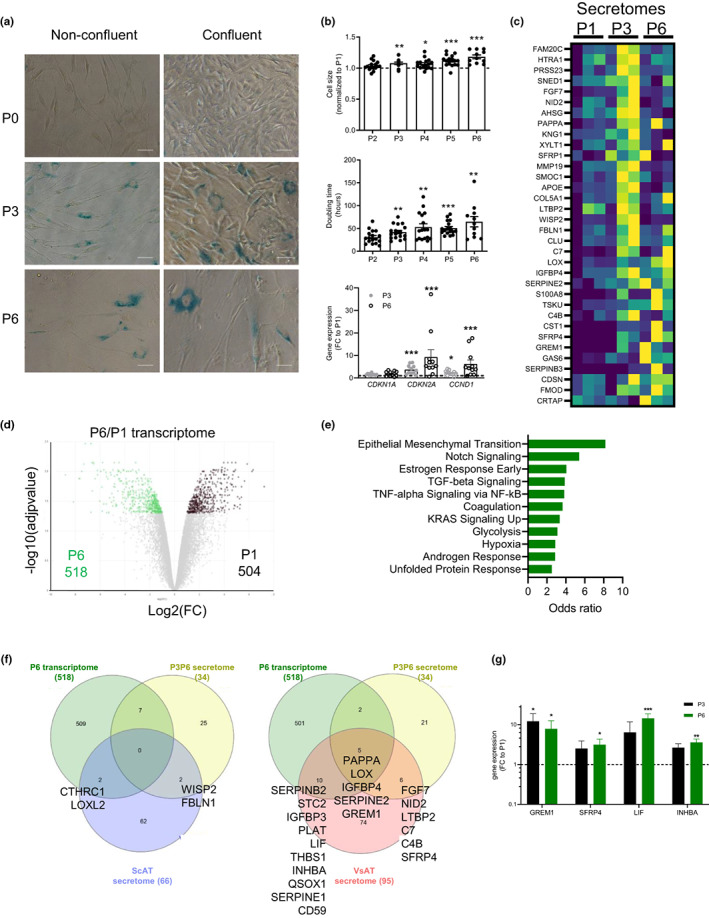
FIGURE 2.

Replicative senescence‐associated secretory phenotype of AT progenitor cells highlights components of the TGFβ/BMP and WNT developmental pathways. (a) SA‐βgal activity by colorimetric staining on nonconfluent or confluent progenitors at Passage 0 (P0), 3 (P3), and 6 (P6). Representative photomicrographs from n = 3 donors are shown. Scale bars: 50 μm. (b) Changes in cell size according to increasing passages. Results are expressed as fold change over P1, means ± SEM of n = 11–17 independent experiments (one‐way ANOVA, Dunnett's post‐test, *p < 0.05, **p < 0.01, ***p < 0.001 compared with P1); changes in doubling time according to increasing passages. Values are means ± SEM of n = 11–17 independent experiments (one‐way ANOVA, Dunnett's post‐test, **p < 0.01, ***p < 0.001 compared with P2, changes in mRNA expression of CDKN2A, CDKN1A, and CCND1 at P3 and P6. Results are expressed as fold change over P1, means ± SEM of n = 15 independent experiments (one‐way ANOVA, Dunn's post‐test, ***p < 0.001 compared with P1). (c) Heatmap of differentially expressed proteins in paired analysis between P1 and P3 and P1 and P6 secretomes from three donors, (deep blue corresponding to the smallest value and yellow to the highest value). (d) Volcano plot of the twofold and more differentially expressed genes between P1 and P6 RNA sequencing transcriptomes performed in three donors. (e) Statistically significantly enriched pathways in the 518 DEGs upregulated in P6 transcriptome in the Human Molecular Signatures Database (MSigDB) hallmark gene sets MSigDB Hallmark (GSEA). (f) Venn diagram of DEGs upregulated in the P6 transcriptome, P3 and P6P3 secretome and ScAT (left) and VsAT (right) native progenitor‐specific secretomes. (g) mRNA levels of SASP proteins GREM1, SFRP4, LIF, and INHBA determined in P1, P3, and P6 progenitor cells by RTqPCR. Results are expressed as fold change over P1, means ± SEM of n = 7 donors (*p < 0.05, **p < 0.01, ***p < 0.001 compared with P1)
