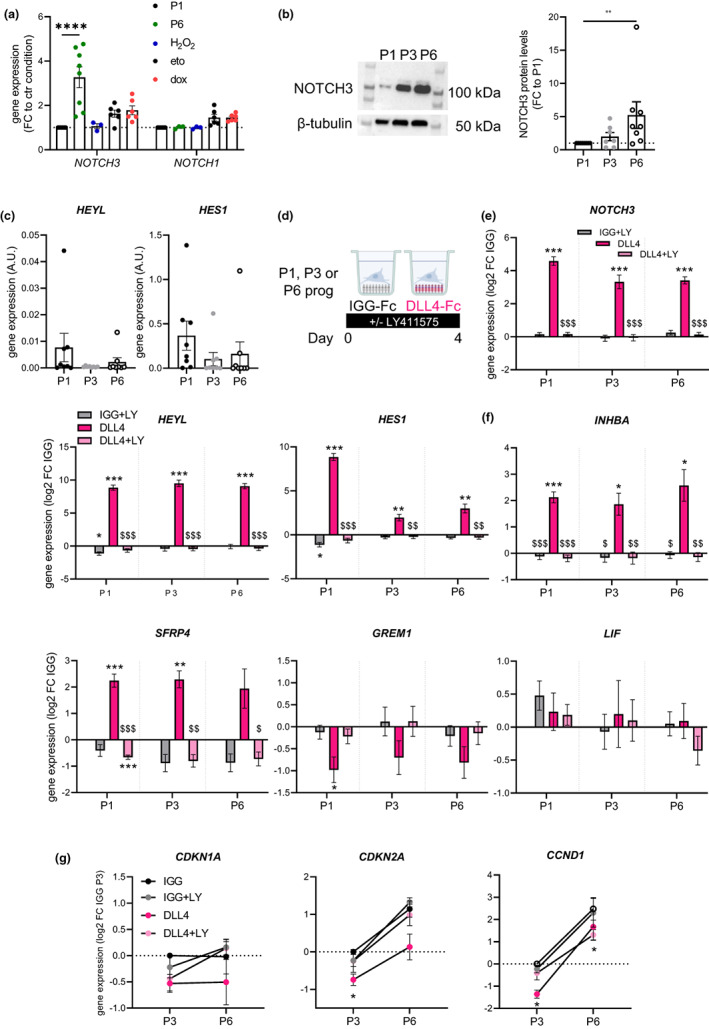
FIGURE 3.

Replicative senescence upregulates the expression of Notch3 and does not alter the responses to Notch activation. (a) NOTCH3 and NOTCH1 transcript levels in progenitor cells at P1, at P6, after H2O2 or etoposide (eto) or doxorubicin (dox) treatments, determined by RTqPCR and RNAseq (H2O2 treatment) and normalized to respective P1 control cells (values are means ± SEM of n = 3–8 donors, two‐way ANOVA, Dunnett's post‐test, ****p < 0.0001). (b) NOTCH3 protein level in progenitor cells at P1, P3, and P6 determined by western blot and quantification of the ratio between the shorter and the higher cleaved form normalized to the β‐tubulin level. Results are expressed as fold change over P1, means ± SEM of n = 7–8 donors (one‐way ANOVA, Dunn's post‐test, **p < 0.01). (c) mRNA levels of HEYL and HES1 in progenitor cells at P1, P3, and P6 determined by RTqPCR (values are means ± SEM of n = 8 distinct donors, one‐way ANOVA, Dunn's post‐test). (d) Immuno‐selected ScAT P1, P3, or P6 progenitor cells were seeded on immobilized IGG control or NOTCH ligand DLL4 and cultured in basal medium supplemented or not with gamma‐secretase inhibitor LY411575 (LY) for 4 days. mRNA levels of (e) NOTCH3 and NOTCH target genes HEYL and HES1, (f) SASP factors INHBA, SFRP4, GREM1, and LIF determined at day 4 by RTqPCR. Results are expressed as log2 fold change over IGG, means ± SEM of n = 7 donors (two‐way ANOVA, Tukey's post‐test, *p < 0.05, **p < 0.01, ***p < 0.001 compared with IGG, $p < 0.05, $$p < 0.01, $$$p < 0.001 compared with DLL4). (g) mRNA levels of senescence markers CDKN1A, CDKN2A, and CCND1 in P3 and P6 progenitor cells determined at day 4 by RTqPCR. Results are expressed as log2 fold change over IGG P3, means ± sem of n = 3–4 donors (two‐way ANOVA, Dunnett's post‐test)
