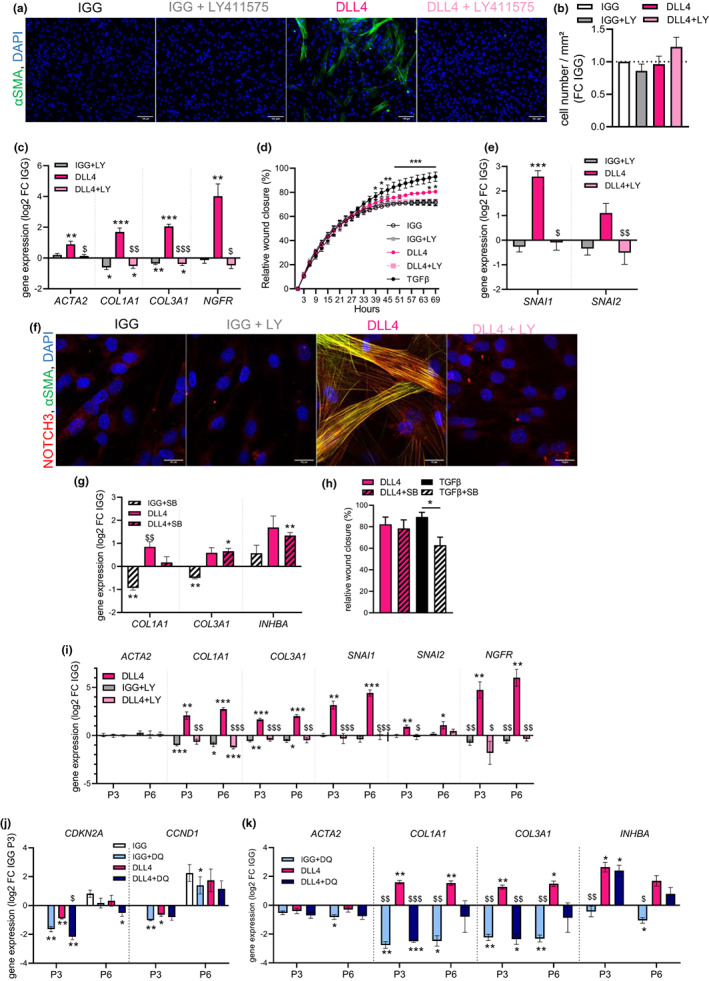
FIGURE 5.

NOTCH‐mediated promotion of myofibrogenesis is not dependent of the TGFβ pathway. (a) Representative photomicrographs of αSMA (green) and DAPI (blue) stainings in immuno‐selected ScAT P1 progenitor cells seeded on immobilized IGG control (white) or NOTCH ligand DLL4 (pink) and cultured in basal medium (without TGFβ1) supplemented or not with gamma‐secretase inhibitor LY411575 (LY: IGG gray; DLL4 light pink) during 4 days. (scale bar = 100 μm). (b) Quantification of cell number at day 4. Results are expressed as fold change over IGG, means ± SEM of n = 3 donors (one‐way ANOVA, Tukey's post‐test). (c) mRNA levels of myofibroblast markers (ACTA2, COL1A1, and COL3A1) determined at day 4 by RTqPCR. (d) Results are expressed as log2 fold change over IGG, means ± SEM of n = 7–11 donors two‐way ANOVA, Dunnett's post‐test, *p < 0.05, **p < 0.01, ***p < 0.001 compared with IGG, $p < 0.05, $$p < 0.01, $$$p < 0.001 compared with DLL4). (d) Relative wound closure expressed as percentage of area over time of progenitor cells seeded on immobilized IGG control or DLL4, treated or not with gamma‐secretase inhibitor LY411575, or in the presence of TGFβ1 (black), and subjected to scratch assay. Images were captured every 3 h during 69 h. The scratch area at time point 0 was set to 0. Values are means ± SEM of n = 3 donors, two‐way ANOVA, Dunnett's post‐test, *p < 0.05, **p < 0.01, ***p < 0.001 (from time points 45–69) compared with IGG. (e) mRNA levels of epithelial‐mesenchymal transition genes SNAI1 and SNAI2 determined at day 4 by RTqPCR. Results are expressed as log2 fold change over IGG, means ± SEM of n = 7 donors (two‐way ANOVA, Dunnett's post‐test, ***p < 0.001 compared with IGG, $p < 0.05, $$p < 0.01 compared with DLL4). (f) Representative photomicrographs of NOTCH3 (red), DAPI (blue) and αSMA (green) stainings in progenitor cells seeded on IGG or DLL4 ligand with and without LY411575 at day 4 (scale bar = 20 μm). (g) mRNA levels of myofibroblast markers (COL1A1, COL3A1, and INHBA) in immuno‐selected P1 progenitor cells seeded on IGG (white) or NOTCH ligand DLL4 (pink) and cultured in basal medium supplemented or not with TGFβ receptor inhibitor SB431542 (IGG + SB hatched white, DLL4 + SB hatched pink) during 4 days, determined by RTqPCR. Results are expressed as log2 fold change over IGG, means ± sem of n = 4 donors (two‐way ANOVA, Tukey's post‐test, *p < 0.05, **p < 0.01 compared with IGG, $$p < 0.01 compared with DLL4). (h) Relative wound closure (expressed as percentage of area) 72 h after scratch wound of progenitor cells seeded on DLL4 or treated with TGFβ1 (black) in the presence or not of SB431542 (TGFβ + SB hatched black). Values are mean ± SEM of n = 4 donors (one‐way ANOVA and Sidak's post‐test). (i) mRNA levels of myofibroblast markers (ACTA2, COL1A1, and COL3A1), epithelial‐mesenchymal transition (SNAI1 and SNAI2) and premyofibroblast marker (NGFR) in immuno‐selected ScAT P3 and P6 progenitor cells seeded on IGG control (white) or DLL4 (pink) and cultured in basal medium supplemented or not with gamma‐secretase inhibitor LY411575 (LY: IGG gray; DLL4 light pink) during 4 days determined by RTqPCR. Results are expressed as log2 fold change over IGG, means ± SEM of n = 7 donors (two‐way ANOVA, Tukey's post‐test, *p < 0.05, **p < 0.01, ***p < 0.001 compared with IGG, $p < 0.05, $$p < 0.01, $$$p < 0.001 compared with DLL4). (j) mRNA levels of senescence markers (CDKN2A and CCND1) in immuno‐selected ScAT P3 and P6 progenitor cells seeded on IGG control (white) or DLL4 (pink) and cultured in basal medium supplemented or not with dasatinib and quercetin (DQ; IGG + DQ light blue; DLL4 + DQ dark blue) during 4 days, determined by RTqPCR. Results are expressed as log2 fold change over P3 IGG, means ± SEM of n = 4 donors (two‐way ANOVA, Tukey's post‐test, *p < 0.05, **p < 0.01 compared with IGG, $p < 0.05 compared with DLL4). (k) mRNA levels of myofibroblast markers (ACTA2, COL1A1, COL3A1, and INHBA) determined at day 4 by RTqPCR. Results are expressed as log2 fold change over IGG, means ± SEM of n = 4 donors (two‐way ANOVA, Tukey's post‐test, *p 0.05, **p < 0.01, ***p < 0.001 compared with IGG, $p < 0.05, $$p < 0.01, $$$p < 0.001 compared with DLL4).
