FIGURE 6.

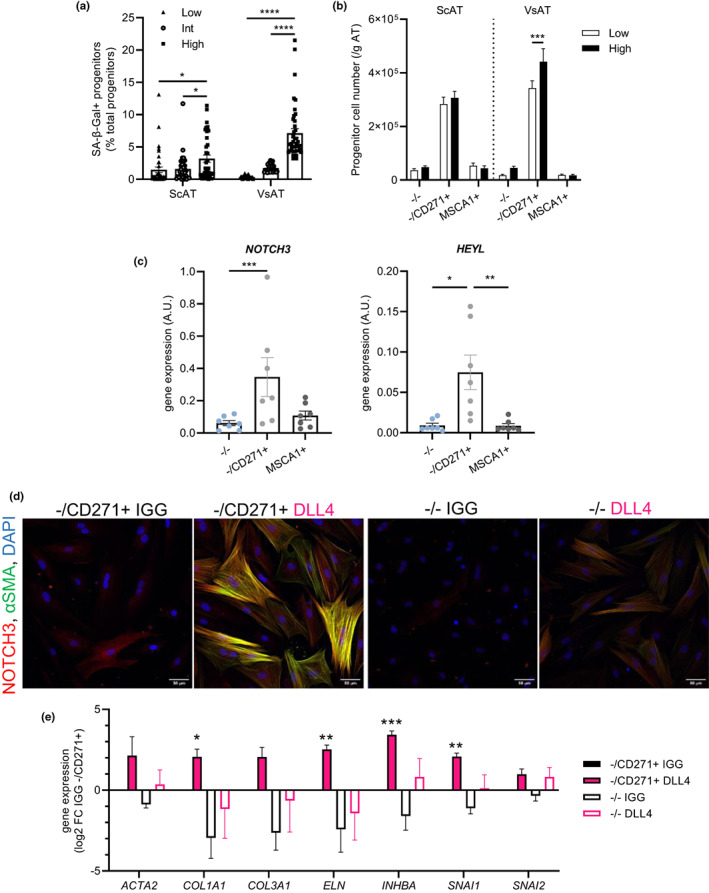
Native −/CD271+ premyofibroblasts accumulate in VsAT with senescence and are the target of the NOTCH3 pathway. (a) Percentage of SA‐β‐gal+ progenitors in ScAT and VsAT when donors were partitioned into tertiles by low, intermediate (int), or high SA‐β‐gal+ percentage in VsAT. Values represent means ± SEM of n = 38 donors in low, n = 39 in int and n = 39 in high VsAT senescence groups (two‐way ANOVA and Tukey's post‐test). (b) Number of progenitor cell subset per gram of ScAT and VsAT from patients in the low (white) and high (black) VsAT senescent tertiles from Figure 1e. Results are expressed as means ± SEM of n = 38 low and n = 39 high donors per group (two‐way ANOVA, Tukey's post‐test). (c) mRNA levels of NOTCH3 and HEYL in freshly isolated progenitor cell subsets (MSCA1−/CD271− (−/−, blue), MSCA1‐/CD271+ (−/CD271+, NGFR+, light gray) premyofibroblasts and MSCA1+ (ALPL+, dark gray) preadipocytes) immuno‐selected from ScAT. Results are expressed as means ± SEM of n = 7 donors (one‐way ANOVA, Dunn's post‐test). (d) Representative photomicrographs of NOTCH3 (red), αSMA (green) and DAPI (blue) stainings P1 in −/CD271+ and −/− progenitor subsets immuno‐selected from ScAT, seeded on IGG control or NOTCH ligand DLL4, and cultured in basal medium during 4 days (scale bar = 50 μm). (e) mRNA levels of myofibroblast markers (ACTA2, COL1A1, COL3A1, ELN, and INHBA) and epithelial‐mesenchymal transition markers (SNAI1 and SNAI2) in −/CD271+ and −/− progenitor subsets seeded on IGG control (−/CD271+ black, −/− white) or NOTCH ligand DLL4 (−/CD271+ pink, −/− pink outline) determined at day 4 by RTqPCR. Results are expressed as log2 fold change over IGG −/CD271+ cells, means ± SEM of n = 5 independent experiments (two‐way ANOVA, Dunnett's post‐test, *p < 0.05, **p < 0.01, ***p < 0.001 compared with IGG
