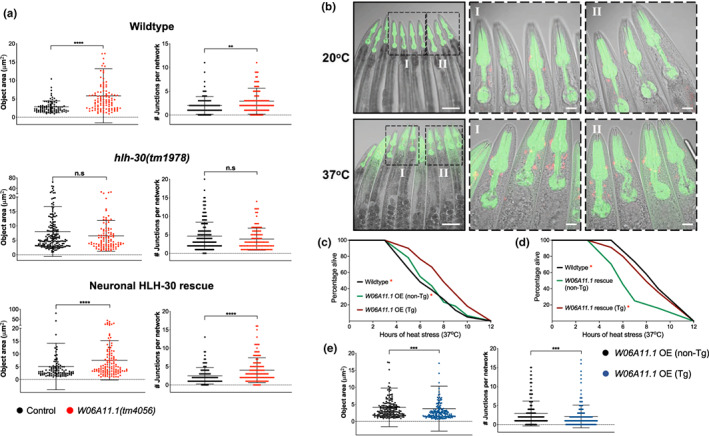
FIGURE 5.

W06A11.1 induces non‐cell autonomous mitochondrial fragmentation to mediate thermoresistance. (a) Analysis of mitochondrial connectivity in the presence and absence of W06A11.1(tm4056) loss of function after 37°C heat stress for 3 h in wildtype, hlh‐30(tm1978), and neuronal HLH‐30/TFEB rescued animals (see Figures S7b–d for additional mitochondrial quantification). Data are representatives of 3 independent replicates (per strain; n = 30, number of ROIs = 88–171) and comparisons were made by Mann–Whitney for each mitochondrial feature (presented as mean ± SD; n.s, p ≥ 0.05; *, p < 0.05; **, p < 0.01; ***, p < 0.001; ****, p < 0.0001). (b) Transgenic (Tg) wildtype animals overexpressing extrachromosomal W06A11.1::DsRed (W06A11.1 OE) at 20°C (control conditions) and after 37°C heat stress for 5 h. Scale bars = 100 μM, images in left column; scale bars = 20 μM, enlarged insets of head regions (I and II). Survival analyses of wildtype, with non‐//transgenic (non‐Tg) and Tg W06A11.1 (c) OE animals and (d) rescued W06A11.1(tm4056) mutants at 37°C heat stress. Data are representatives of 2 independent replicates and comparisons were made by Mantel‐Cox log‐rank (n = 90–120/strain; *, p < 0.05; comparison of (c) wildtype and non‐Tg to Tg and (d) wildtype and Tg to non‐Tg). (e) Analysis of mitochondrial connectivity in W06A11.1 OE Tg and non‐Tg siblings at 20°C (see Figure S8b, c for representative images and additional mitochondrial quantification). Data are representatives of 2 independent replicates (per strain; n = 30, number of ROIs = 157–167) and comparisons were made by Mann–Whitney for each mitochondrial feature (presented as mean ± SD; n.s, p ≥ 0.05; **, p < 0.01; ***, p < 0.001; ****, p < 0.0001). All animals were developed at 20°C to day 1 of adulthood and where indicated, were further exposed to 37°C heat stress for (a, e) 3 h, (b) 5 h, or (c, d) until death.
