FIGURE 1.

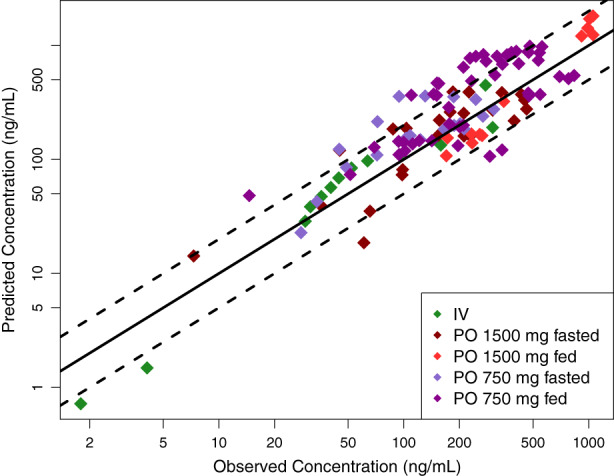
The i.v. and oral model predicted vs observed mean CBD plasma concentrations for evaluation (R 2 = 0.68). The solid and dashed lines represent the identity line and two‐fold differences, respectively. CBD, cannabidiol.

The i.v. and oral model predicted vs observed mean CBD plasma concentrations for evaluation (R 2 = 0.68). The solid and dashed lines represent the identity line and two‐fold differences, respectively. CBD, cannabidiol.