
FIGURE 1.
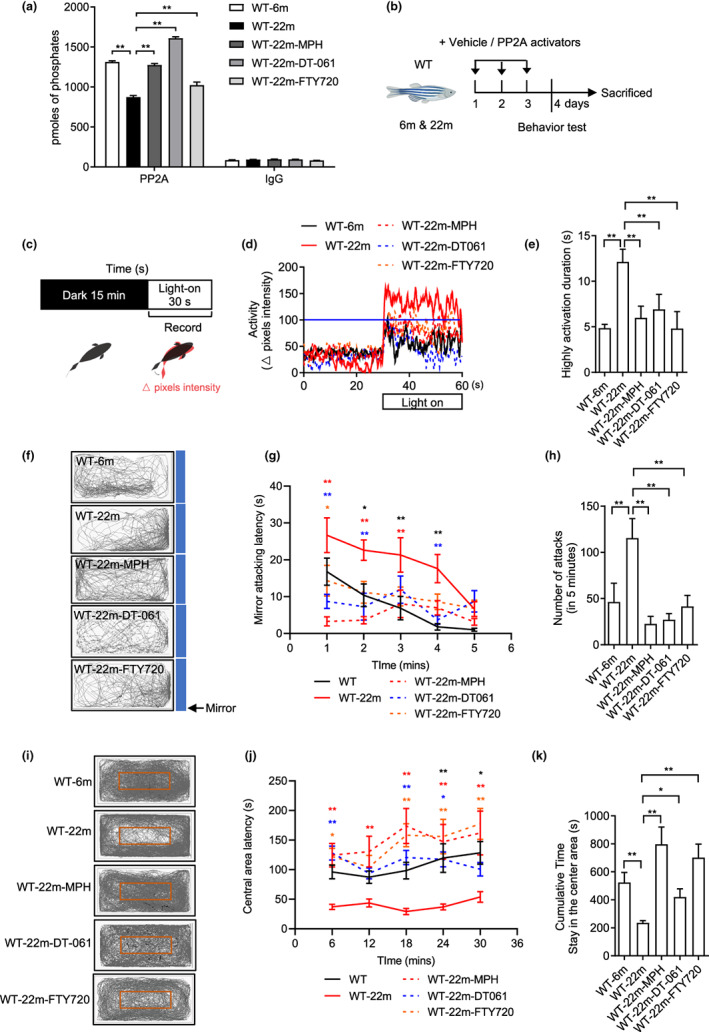
PP2A activators reverse the behavioral changes of old fish. (a) PP2A phosphatase assay after the treatment of PP2A activators in old fish (n = 3 independent biological samples, each group contained two brains; one‐way ANOVA). The IgG assays correspond to controls of the PP2A immunoprecipitation. (b) Experimental design of behavioral tests with 6‐month‐old (adult) and 22‐month‐old (old) WT with or without PP2A activators treatment for 3 days. (c) Experimental scheme for the light–dark transition assay. Parameters recorded and analyzed in light–dark transition assay. (d) Representative diagram of locomotion activity during the 30‐s lights‐on period and 30 s before lights‐on. (e) Quantification of the highly activation state (see Section 4) duration during the 30‐s lights‐on period (n = 8 for 6 m, n = 15 for 22 m, n = 11 for 22m‐MPH, n = 9 for 22m‐DT‐061 and 22m‐FTY720; one‐way ANOVA). (f) Representative movement tracks (gray lines) in the mirror attack assay of adult fish during the 5‐min trial. Blue boxes show the position of the mirror. (g) Mirror attacking latency at indicated time point in 5‐min trail. (Two‐way ANOVA, statistic difference is shown as WT‐6m vs. WT‐22m (black *), WT‐22m vs. WT‐22m‐MPH (red *), WT‐22m vs. WT‐22m‐DT‐061 (blue *), WT‐22m vs. WT‐22m‐FTY720 (orange *)). (h) Quantification of the number of mirror attacks in 5‐min intervals (n = 14 for 6 m, n = 15 for 22 m, n = 12 for 22m‐MPH, n = 9 for 22m‐DT‐061 and 22m‐FTY720; one‐way ANOVA). (i) Representative movement tracks (gray lines) during the 30‐min trial in the open field test. The red box shows the central area of the tank. (j) Central area latency at indicated time point in 30‐min trail. (Two‐way ANOVA, statistic difference are shown as WT‐6m vs. WT‐22m (black *), WT‐22m vs. WT‐22m‐MPH (red *), WT‐22m vs. WT‐22m‐DT‐061 (blue *), WT‐22m vs. WT‐22m‐FTY720 (orange *)). (k) Cumulative time that the adult fish stayed within the central area (n = 16 for 6 m, n = 8 for 22 m, n = 10 for 22m‐MPH, n = 9 for 22m‐DT‐061 and 22m‐FTY720; one‐way ANOVA). Data are means ± SEM. *p < 0.05, **p < 0.01