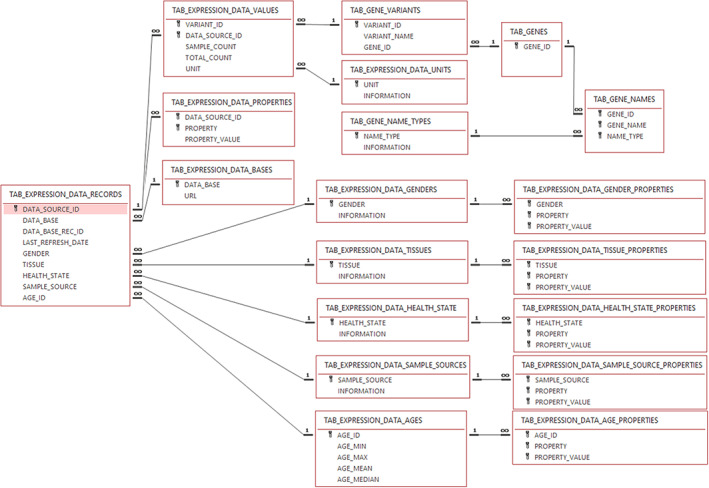
FIGURE 2.

Layout of the Open Systems Pharmacology Suite interoperable gene expression databases. Rectangles represent distinct data tables with the first row being the table name. Key symbols indicate the unique key variables of the respective table. Lines indicate how individual variables are interconnected over multiple tables. Symbols indicate if an entry is mapped to multiple (∞) or a single entry (1).
