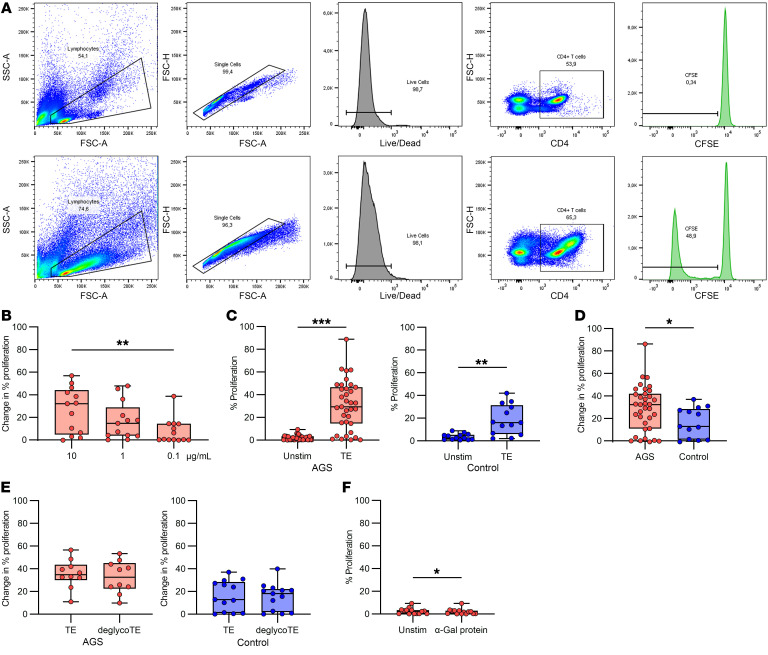
Figure 1. T cell proliferation measured by dilution of CFSE.
(A) Gating strategy for proliferation of CD4+ T helper cells. (B) T cell proliferation in response to different doses of TE in patients with AGS, Friedman test with Dunn’s multiple comparisons test, **P < 0.01, n = 13. (C) T cell proliferation to TE compared with unstimulated cells in patients with AGS (left, n = 35) and healthy controls (right, n = 16), Wilcoxon matched-pairs signed rank test, **P < 0.01, ***P < 0.001. (D) Comparison of patients with AGS and healthy controls, Mann-Whitney U test, *P < 0.05, n = 35 (AGS) and n = 13 (controls). (E) T cell proliferation after removal of α-Gal from the TE in patients with AGS (left, n = 10) and healthy controls (right, n = 13), Wilcoxon matched-pairs signed rank test. (F) T cell proliferation to an α-Gal containing nontick protein in patients with AGS, Wilcoxon matched-pairs signed rank test, *P < 0.05, n = 14. Each point within the box plot represents 1 individual. Box plots represent IQR and median, whiskers extend to the farthest data points.

