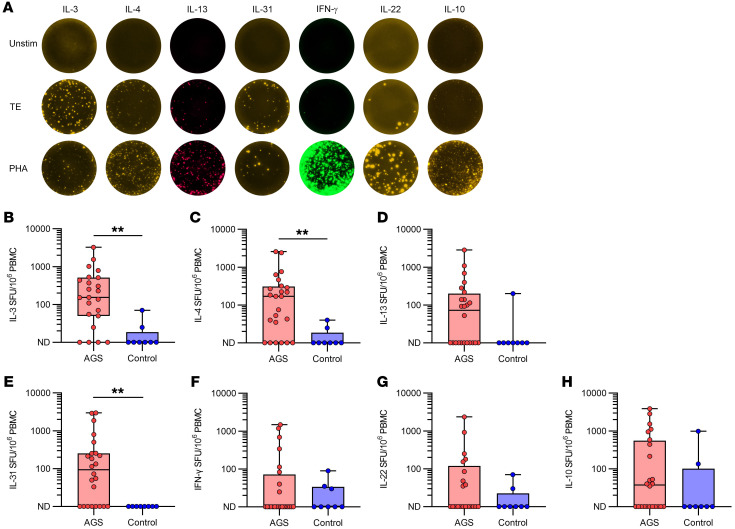
Figure 2. Cytokine expression by PBMCs in response to TE from patients with AGS and healthy controls.
(A) Representative photos of FluoroSpot wells from a patient with AGS for unstimulated cells, TE-stimulated cells, and PHA-stimulated cells. (B) IL-3, (C) IL-4, (D) IL-13, (E) IL-31, (F) IFN-γ, (G) IL-22, and (H) IL-10. Mann-Whitney U test, **P < 0.01, n = 24 (AGS, n = 23 for IL-3) and n = 8 (control). Each point within the box plot represents 1 individual. Box plots represent IQR and median, whiskers extend to the farthest data points.

