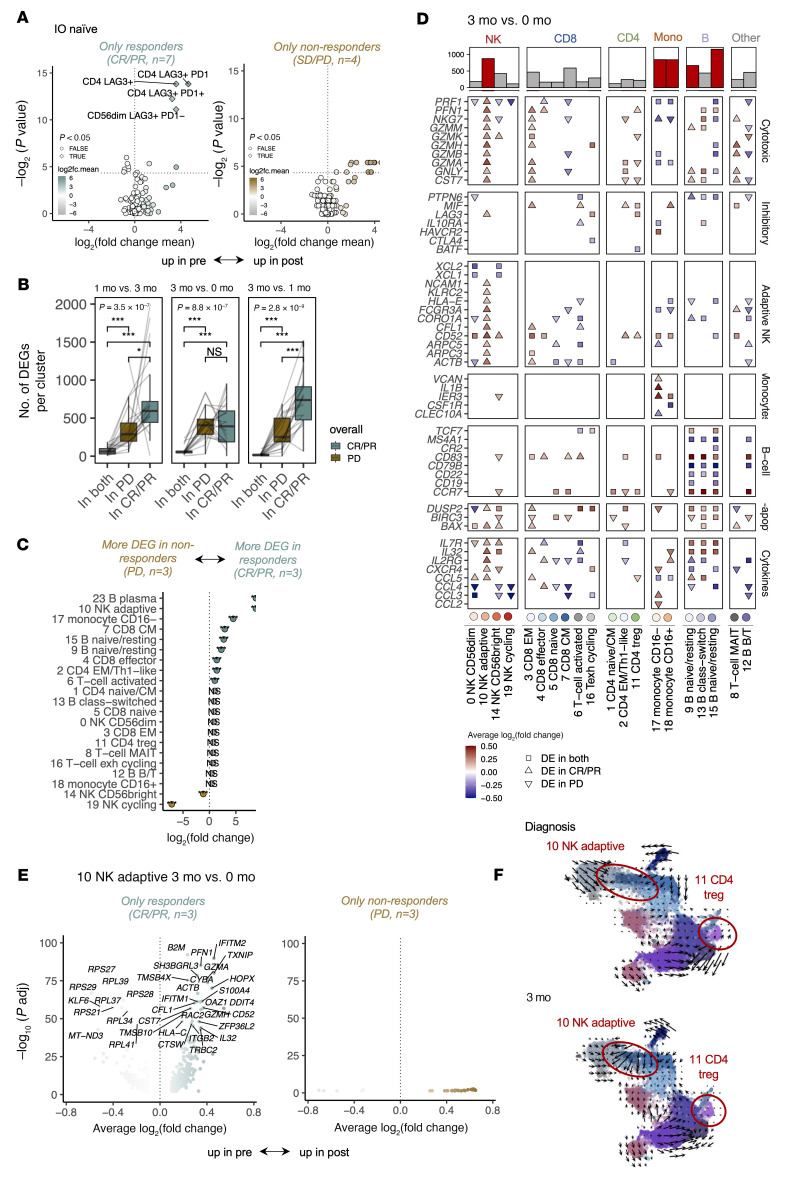
Figure 3. Anti–LAG-3+anti–PD-1 treatment upregulates LAG3 and invigorates adaptive NK cells.
(A) Differentially abundant (Padj < 0.05, Benjamini-Hochberg–corrected Mann-Whitney U test) flow cytometry subpopulations between 3 months of anti–LAG-3+anti–PD-1 treatment and baseline in IO-naive patients (n = 13) with a response (CR/PR n = 7) and with a nonresponse (SD/PD n = 4). The dashed line denotes P = 0.05. (B) The number of DEGs (Padj < 0.05, Bonferroni-corrected t test) between different time points in the different scRNA-Seq populations (Figure 2A) of cells from patients with (CR/PR, n = 3) or without (PD, n = 3) a response. P values were calculated with the Kruskal-Wallis test. (C) The log2 fold change of DEGs in scRNA-Seq data of patients with (CR/PR, n = 3) or without (PD, n = 3) a response after 1 month of anti–LAG-3+anti–PD-1 treatment. P values were calculated with Fisher’s 2-sided exact test, and significant values needed to have at least a |log2 fold change| >1. **P < 0.01 and ***P < 0.001. (D) DEGs in the scRNA-Seq data as log2 average fold changes (avg_logFC) between 3 months of anti–LAG-3+anti–PD-1 treatment and baseline. The shape denotes whether the gene was a DEG in patients with a response (DE in CR/PR), without a response (DE in PD), or in both (DE in both). Colors indicate upregulation at 3 months (red) or baseline (blue), and the shape indicates whether the DEG was found in patients with CR/PR, PD, or both. The bar plot on top shows the number of DEGs between 3 months of anti–LAG-3+anti–PD-1 treatment and baseline in different immune cell subpopulations, with the top 5 cell populations colored red. (E) DEGs (Padj < 0.05, Bonferroni-corrected t test) in adaptive NK cells (cluster 10) between 3 months (right) and baseline (left) in the scRNA-Seq data of patients with (CR/PR, n = 3) or without (PD, n = 3) a response. (F) UMAP representation of the scRNA-Seq samples from CMV-seropositive patients (n = 4), where superimposed arrows represent the directional flow calculated with Velocyto by comparing the abundances of spliced and unspliced mRNA reads. Arrows are smoothed with Gaussians.

