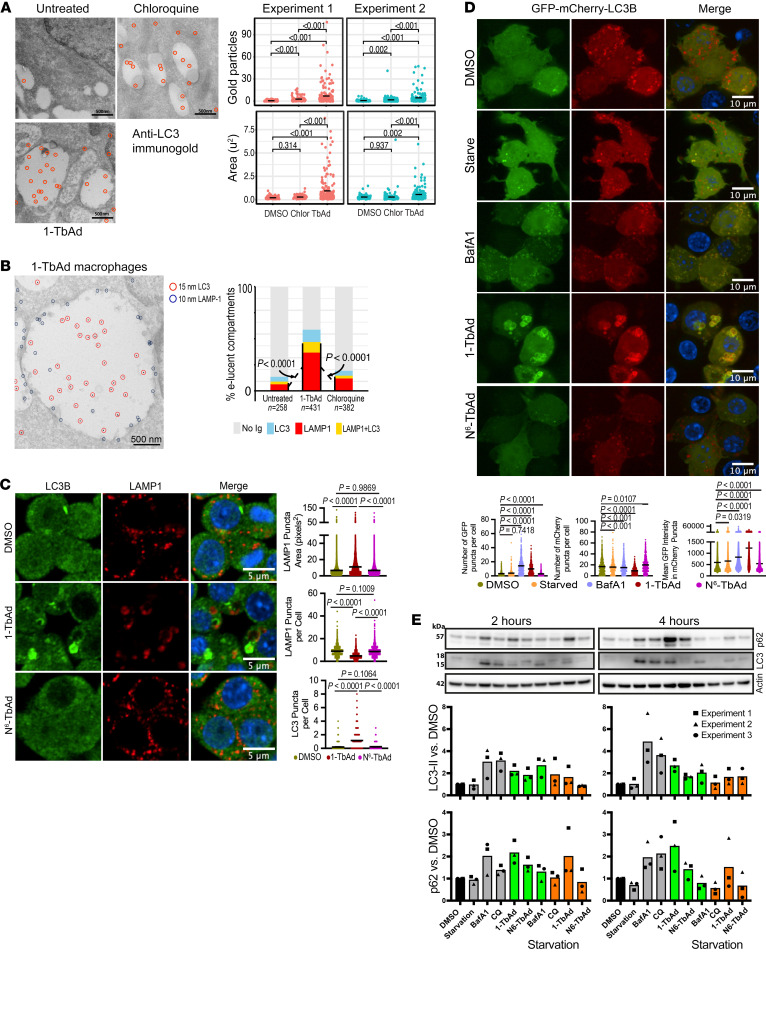
Figure 2. 1-TbAd causes the accumulation of autophagosomes due to blockage of autophagic flux.
(A and B) M1 macrophages treated with chloroquine or 1-TbAd (20 μM) for 2 hours were immunogold labeled for LC3, LAMP1, or both markers. The area (μm2) of electron-lucent compartments was measured and the number of gold particles were counted per compartment. Double-immunogold labeling was scored as no label (<3 particles) or labeled (>3 particles), with subgroups of LAMP1 single positive, LC3B single positive, and LAMP1 AND LC3B double positive. Single LC3 analysis used a linear model with a negative binomial fit, with P values determined by factorial ANOVA and Tukey’s post test. Linear mixed models treated the double label as a random effect variable (χ2 P << 0.0001). For single and double labels, P values were determined by least squares mean post-test after factorial ANOVA and adjustment by Tukey’s method. (C) RAW264.7 macrophages stimulated for 4 hours were analyzed by immunofluorescence for LC3B recruitment to LAMP1+ compartments. Scale bars: 5 μm. One representative experiment of 3 experiments is shown. P values were determined by Browne-Forsythe ANOVA followed by Games-Howell’s multiple comparisons. (D) RAW264.7 macrophages transiently expressing GFP-mCherry-LC3B were treated with vehicle (DMSO), BafA1, 1-TbAd, or N6-TbAd for 4 hours and then fixed. Black bars indicate the mean values and the data are representative of 3 experiments. *P < 0.05, ***P < 0.001, and ****P < 0.0001, by Browne-Forsythe ANOVA followed by Games-Howell’s multiple-comparison test. Scale bars: 10 μm. (E) In 3 experiments, RAW264.7 macrophages were stimulated for 2 hours or 4 hours and then subjected to Western blotting.

