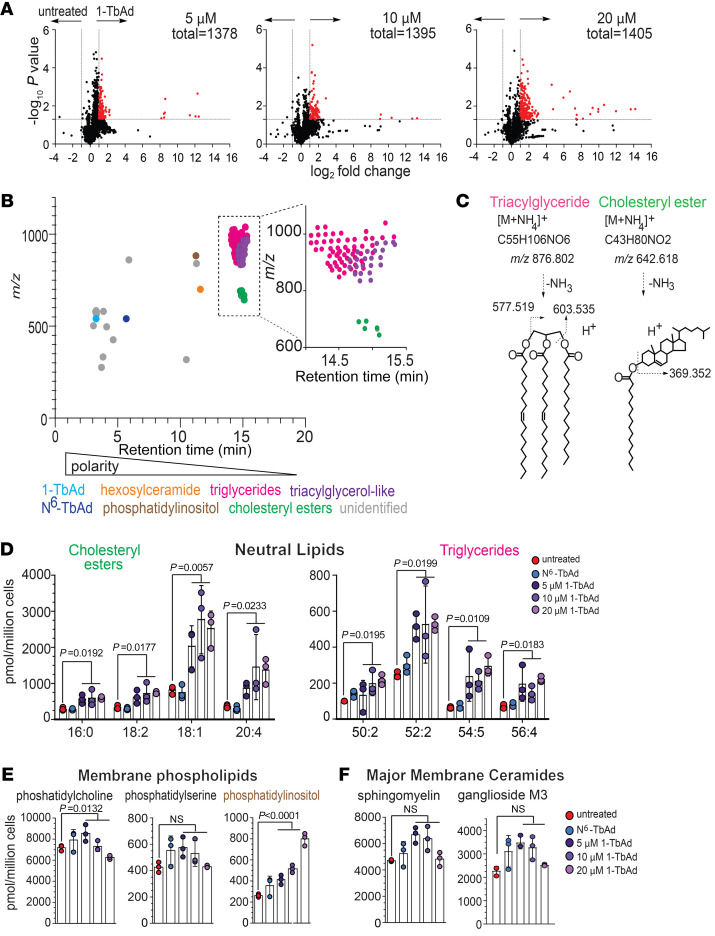
Figure 3. Lipidomic analysis of 1-TbAd–induced lipid storage in macrophages.
(A) Human macrophages were treated in biological triplicate and normalized to the cell number prior to lipid extraction. Positive-mode HPLC-MS lipidomics data sets were aligned, and intensity ratios for every detected lipid allowed the identification of changed molecular events (red, P < 0.05, >2-fold). (B) Unique changed molecular events were plotted by retention time and m/z, where structurally related molecules cluster. (C) Lead ions in TAG and CE clusters were identified on the basis of the mass of ammonium adducts and the diagnostic cleavage. (D–F) The quantities of PC, PS, PI, and sphingomyelin (SM) were assigned on the basis of authentic standard curves (Supplemental Figure 7). The GM3 structure was solved by CID-MS and coelution with an authentic standard (Supplemental Figure 8). P values in D–F were determined by 1-way ANOVA followed by a post test for linear trend.

