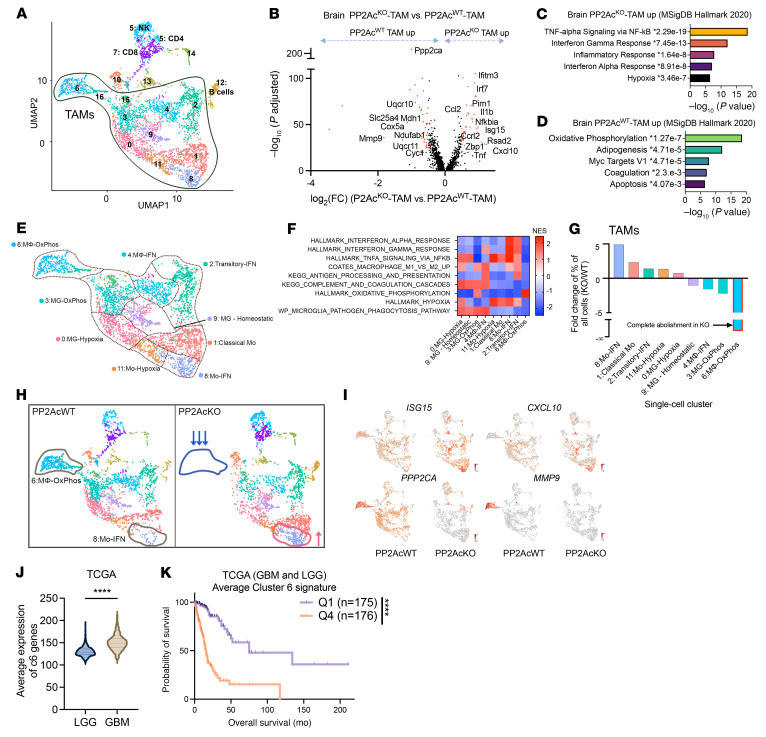
Figure 5. scRNA-Seq of i.c. SB28 tumor.
(A) UMAP of CD45+ immune cells of i.c tumors in Figure 4A. Canonical markers were used to identify major immune populations. (B) Volcano plots showing DEGs (−log10 (adjusted P) > 20, log2FC > 0.5) in CD68+TAMs between tumors from LysMcrePP2Acfl/fl or WT mice. P value adjusted using Bonferroni’s correction. Upregulated genes related to IFN signaling, and downregulated genes related to oxidation phosphorylation are labelled. (C and D) Pathway enrichment analyses using Enrichr showing upregulated (C) and downregulated (D) DEGs of TAMs in tumors from LysMcrePP2Acfl/fl mice. Top 5 enriched biological processes ranked by –log(P). (E) Overview of TAM subsets with 9 subclusters identified: subcluster 0, hypoxic macrophage; subcluster 1, classical monocytes; subcluster 2, transitory-IFN; subcluster 3, Ox-Phos microglia; subcluster 4, IFN macrophage; subcluster 6, Ox-Phos macrophage; subcluster 8, IFN monocytes; subcluster 9, homeostasis microglia; and subcluster 11, hypoxic monocytes. (F) Heatmap of Normalized Enrichment Score (NES) from GSEA identified pathway enrichment in each TAM cluster. (G) Fold change in frequency of the 9 TAMs clusters. (H) UMAP of immune cells highlighting the clusters that are altered between tumors from LysMcrePP2Acfl/fl or WT mice. (I) UMAP of TAMS highlight IFN-response genes (CXCL10 and ISG15), MMP9 and PP2Ac in TAMs from LysMcrePP2Acfl/fl or WT mice. (J) Average expression of cluster 6 gene signature is higher in high grade glioma (n = 171) than in low grade glioma (n = 530) from TCGA data set. P value calculated by 2-tailed unpaired t test (****P < 0.0001). (K) Average expression level of cluster 6 gene signature is associated with worse survival in patients with glioma using TCGA bulk RNA-Seq data set (merged LGG and HGG). Mantel-Cox log-rank tests were used for survival analysis. ****P < 0.0001.

