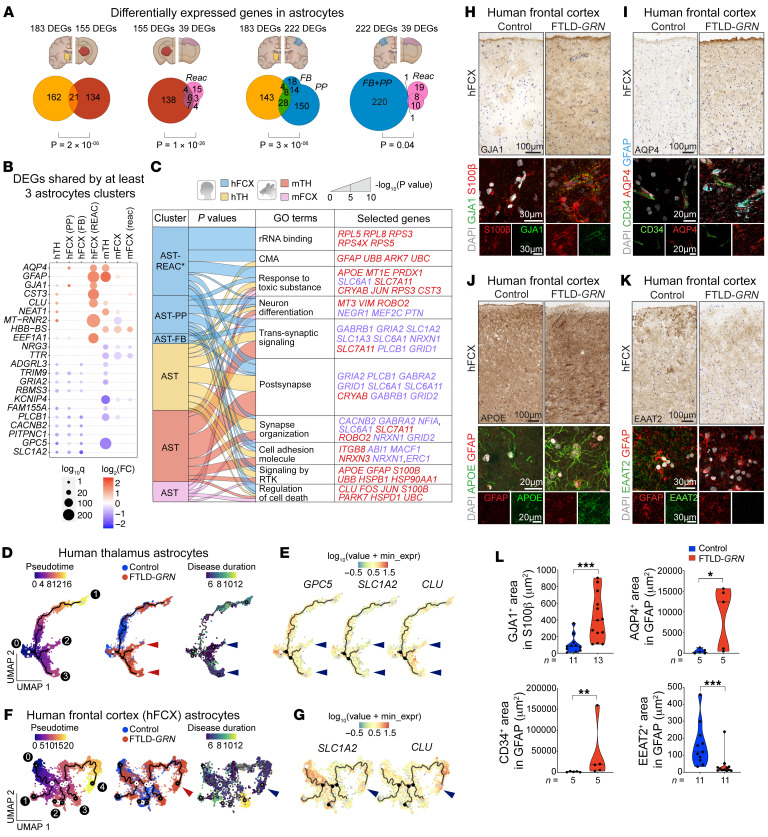
Figure 5. Conserved transcriptomic and phenotypic changes in astrocytes in FTLD-GRN and Grn–/– mice.
(A) Venn diagrams showing the overlap of DEGs in the astroglial (AST) clusters from hTH, hFCX, mTH and mFCX. Statistics uses hypergeometric tests. (B) DEGs shared by ≥3 AST clusters in mTH, mFCX, hTH and hFCX, with a scale indicating log2 Fold Change that has a cutoff from –0.5 to 0.5. Dot size indicates the log10 Q value for each DEG and color scale indicates log2 Fold Change. Blue and red indicate down- and up-regulated DEGs, respectively. (C) Alluvial plot showing the overlap of GO terms defined by DEGs from AST clusters in hTH, hFCX, mTH, and mFCX. Band width represents P values calculated by accumulative hypergeometric distribution. CMA, chaperone-mediated autophagy; RKT, receptor tyrosine kinases. (D) Pseudotime analysis of AST clusters in hTH based on UMAP (left panel), control versus. FTLD-GRN (middle panel), or disease duration (right panel). (E) Expression of GPC5, SLC1A2, and CLU projected onto UMAP of AST cluster in hTH. (F) Pseudotime analysis of the AST clusters in hFCX based on UMAP (left panel), control versus FTLD-GRN (middle panel), or disease duration (right panel). (G) Expression of SLC1A2 and CLU projected onto UMAP of AST cluster in hFCX. (H–K) Immunohistochemical (top) and confocal images (bottom) of GJA1 (H), AQP4 (I), APOE (J), and EAAT2 (K) in hFCX of control and FTLD-GRN. (L) Quantification of GJA1, CD34, AQP4, and EAAT2 expression on immunostains in control and FTLD-GRN cases. Statistics uses 2-tailed Student’s t test, and n represents the number of independent samples tested. All data represent mean ± SEM. *P < 0.05, **P < 0.01, ***P < 0.005. Scale bars: 100μm (immunostains); 20 μm and 30 μm (confocal images).

