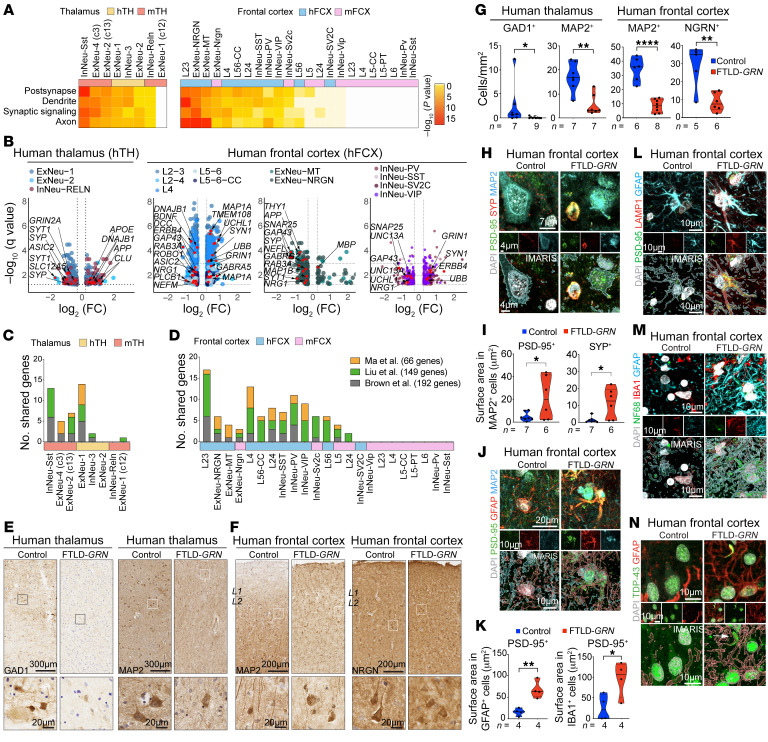
Figure 6. Neuronal phenotypes in patients with FTLD-GRN and Grn–/– mice.
(A) Heatmaps showing the top 4 GO terms shared by the neuronal clusters in hTH, hFCX, mTH, and mFCX. Statistics use hypergeometric tests. (B) Volcano plots showing DEGs in neuronal clusters in hTH and hFCX and genes related to the GO terms in A. (C and D) Bar graphs showing the number of DEGs in the neuronal clusters in patients with FTLD-GRN and Grn–/– mice that overlap with TDP-43-mediated misspliced genes. (E and F) Immunostains for GAD1 and MAP2 in hTH (E) and for MAP2 and NRGN in hFCX (F) in control and FTLD-GRN cases. Scale bars: 300 μm (E, top); 200 μm (F, top); 20 μm (E and F, bottom) (G) Quantifications of GAD1+ and MAP2+ cells in hTH, and MAP2+ and NRGN+ cells in hFCX in control and FTLD-GRN cases. (H) Confocal and IMARIS images of PSD-95+, SYP+, and PSD-95+/SYP+ synapses near MAP2+ neurons in hFCX of control and FTLD-GRN patients. Scale bars: 7 μm (top); 4 μm (middle and bottom). (I) Quantification of PSD-95+ or SYP+ area in MAP2+ neurons in control and FTLD-GRN cases. (J) Confocal and IMARIS images of PSD-95+ in GFAP+ processes and cell bodies in L2/3 of hFCX in control and FTLD-GRN cases. Scale bars: 20 μm (top); 10 μm (middle and bottom). (K) Quantification of PSD-95+ area in GFAP+ or IBA1+ cells in control and FTLD-GRN cases. (L) Confocal and IMARIS images showing colocalization of PSD-95+ and LAMP1+ vesicles in GFAP+ astrocytes in hFCX of control and FTLD-GRN cases. Scale bars: 10 μm. (M and N) Confocal and IMARIS images of NF68, IBA1, and GFAP (M) and TDP-43 and GFAP (N) in hFCX of control and FTLD-GRN cases. Scale bars: 10 μm. All data represent mean ± SEM. Statistics in G, I, and K uses 2-tailed student’s t test, and n represents the number of independent samples tested. *P < 0.05, **P < 0.01, ***P < 0.005, ****P < 0.0001.

