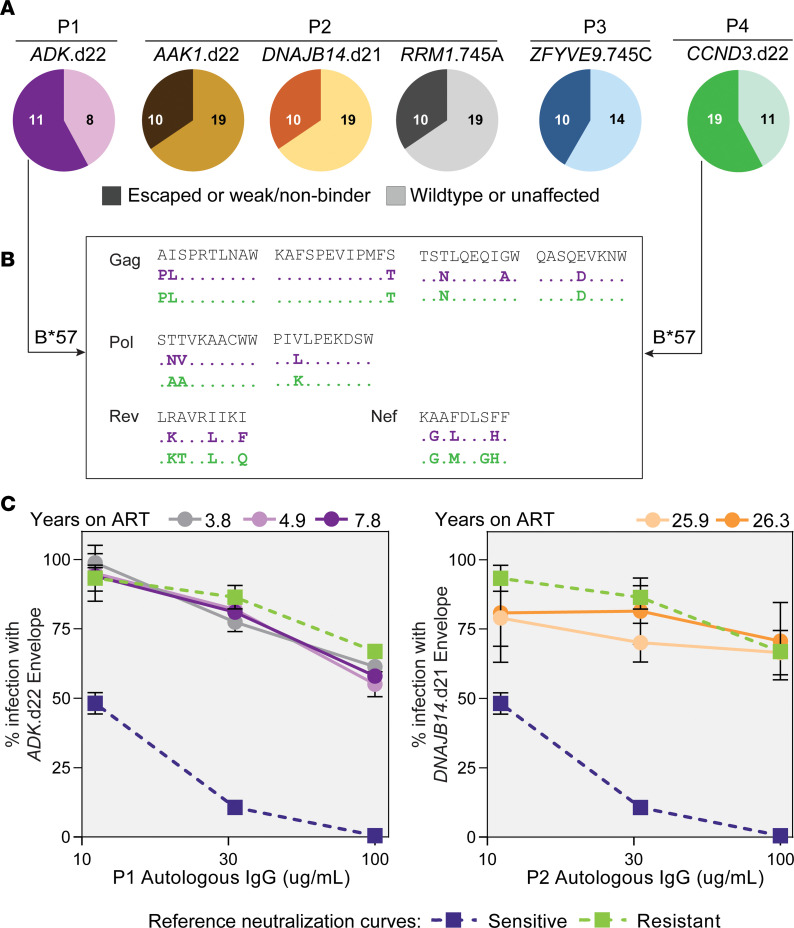
Figure 8. Proviruses contributing to viremia show variable proportion of CTL escape mutations and are resistant to autologous neutralization.
(A) Distribution of T cell epitopes from full proviral genomes. Documented escape mutations and predicted weak or nonbinders are indicated in darker shades (left section of the pie charts). Numbers within pie charts represent the number of epitopes analyzed in each category. (B) Representative epitopes restricted by HLA-B*57 showing mutations with documented impact on HLA binding. (C) Neutralization experiments with autologous IgGs and viruses pseudotyped with envs from proviruses of interest. Error bars indicate SD of 3 technical replicates. Neutralization curves of stereotypical sensitive (blue) and resistant (green) envs are displayed for reference.

