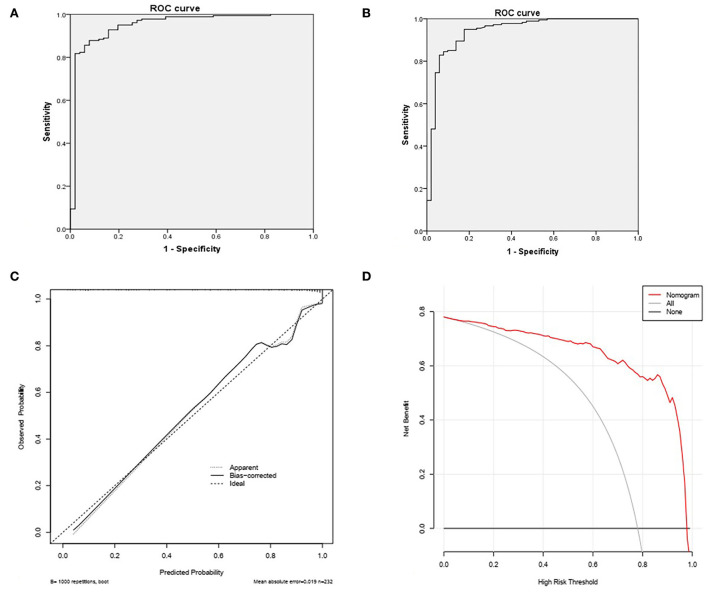
Figure 2.
(A) The area under ROC curve of Model 1 was 0.950. The sensitivity was 95.0% and the specificity was 82.4%. (B) The area under the ROC curve of Model 2 was 0.941. The sensitivity was 92.8% and the specificity was 84.3%. (C) The Bootstrap method, repeated sampling 1000 times, was used for validation, and the C-index value was 0.94. (D) In the range of 0.01–1, the net benefit rate of the model 2 that predicts NGT removal in PSD patients is >0.

