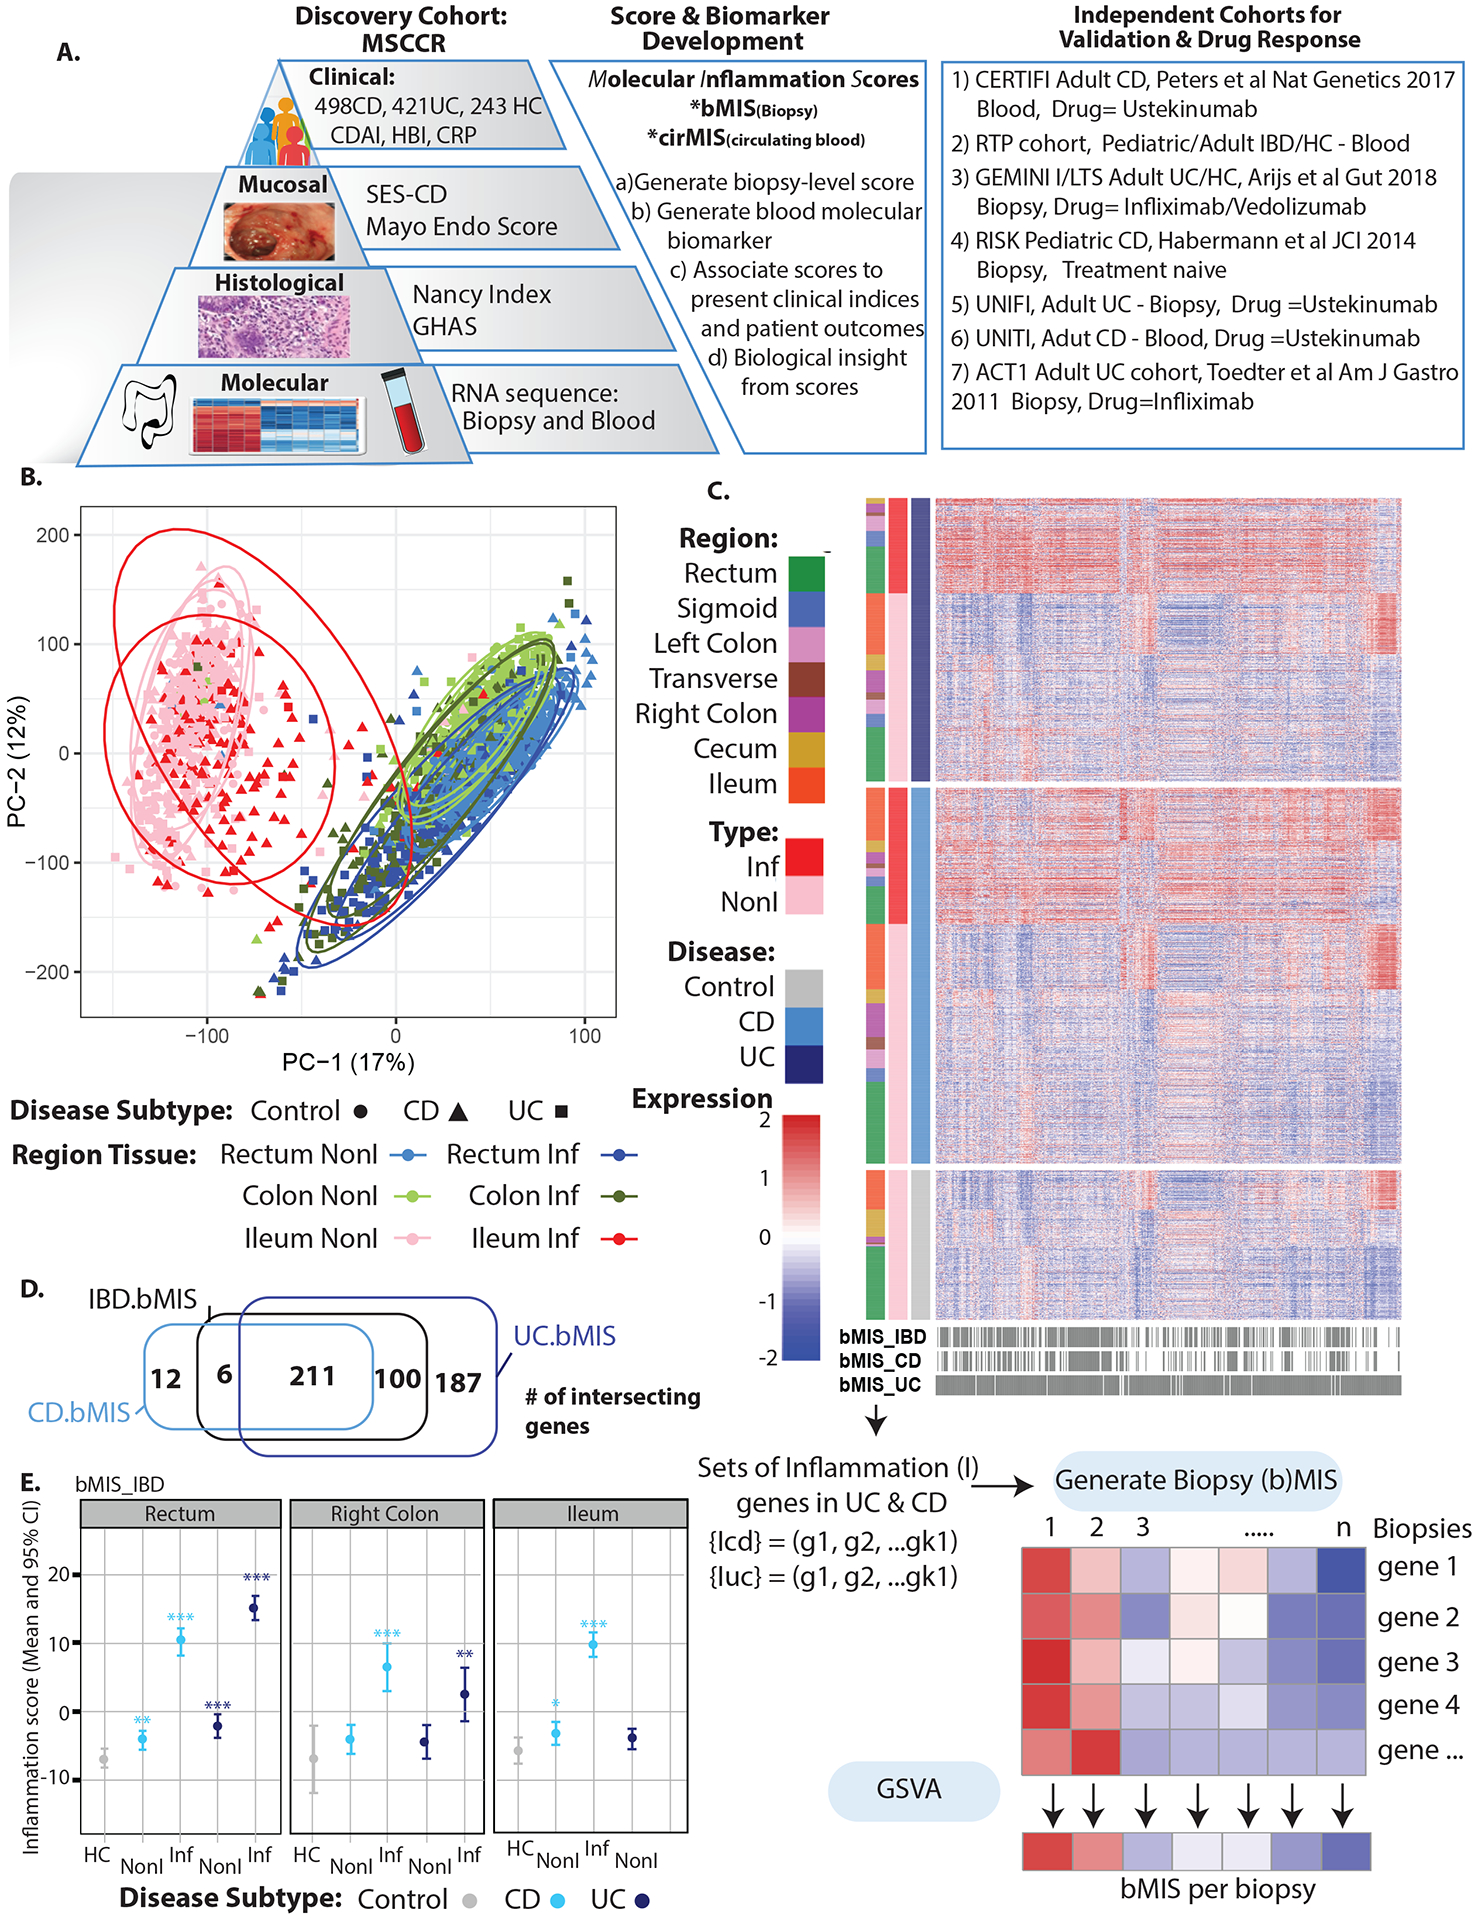
Figure 1.

A. Schematic of analysis plan B. PCA of biopsy expression data for the MSCCR cohort by colonic region, endoscopically defined inflamed (Inf) or non-inflamed (NonI) tissue and by disease subtype (UC/CD and non-IBD controls). C. Heatmap representing the expression levels of the set of bMIS genes (UC, CD or IBD) in IBD patient or non-IBD control biopsies and labeled by region, disease type and inflammation status. D. Venn Diagrams showing the number of differentially expressed genes for bMIS IBD, bMIS UC and bMIS CD signatures. E. Estimated marginal mean (EMM) and 95% CI for bMIS_IBD levels by intestinal region, inflammation status and disease subtype (HC = healthy controls).
