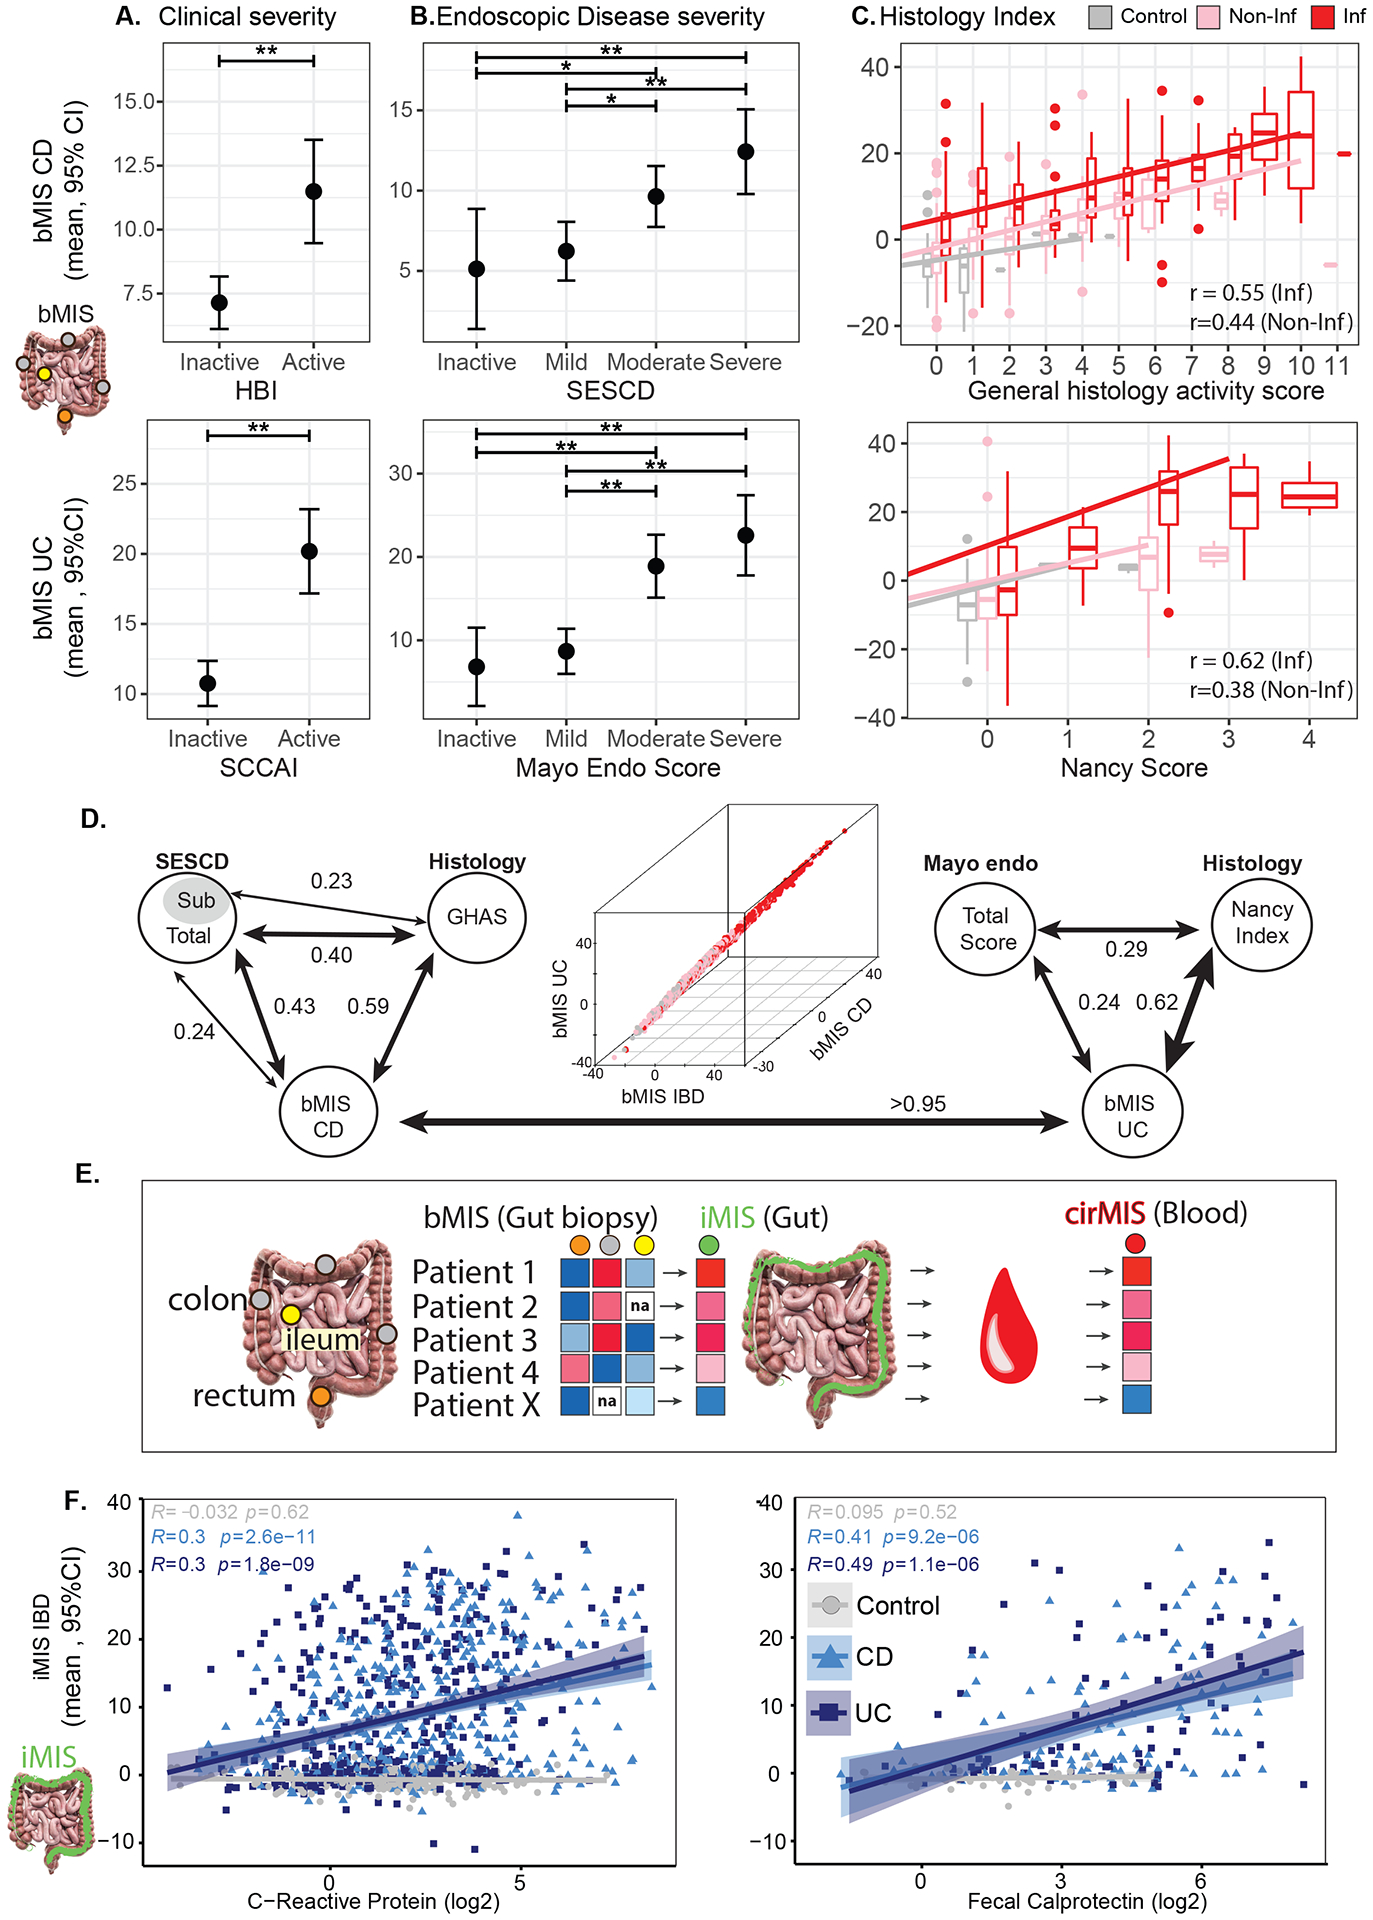
Figure 2.

Association of bMIS in inflamed tissue with (A) Clinical (HBI for CD patients, SCCAI for UC patients), (B) Endoscopic (SESCD for CD patients, Mayo score for UC patients) and (C) Histological (GHAS for CD patients, Nancy score for UC patients) disease severity for CD (top) and UC (bottom). A-B Estimated marginal mean (EMM) and 95% CI for bMIS estimated from a mixed-effect model including clinical activity or disease severity, age, sex and region as fixed-effects. C. Scatter plots representing the distribution of bMIS across histological scores for CD and UC with corresponding regression line. The pink and red line corresponds to the regression line for inflamed and non-inflamed tissue. (GHAS (top): Inflamed tissue, bMIS=2.619 + 1.997*GHAS, Pearson r: 0.55; Non-inflamed tissue, bMIS = −3.926+2.018*GHAS, Pearson r: 0.44; Nancy (bottom): Inflamed tissue: bMIS=1.74+8.457*Nancy, Pearson r: 0.62; Non-inflamed tissue: bMIS= −5.269+5.216*Nancy, Pearson r: 0.38). *: p<0.05; **: p<0.01; ***: p<0.001; ****: p<0.0001. D. Pair-wise correlation analysis (Spearman values) between bMIS scores in biopsies and corresponding endoscopic and histologic scores for CD (left) or UC (right) in MSCCR patients. 3D plot showing correlations (Spearman) between bMIS_UC, bMIS_CD and bMIS_IBD. E. Schema showing the process of obtaining an intestine-level molecular-based inflammation measure (iMIS) per patient using the multiple regions sampled per patient and their bMIS (biopsy-based) scores (see methods). The blood gene expression data was then modeled using a linear model with the continuous variable iMIS (see methods) to identify genes that reflects intestinal inflammation and then generate a circulating molecular score (cirMIS) using GSVA. F. Scatterplots between iMIS_IBD levels and CRP (log2) (left) or fecal calprotectin (log2) (right) within each group (Control, CD, and UC), with Pearson’s correlation coefficients r and p value.
