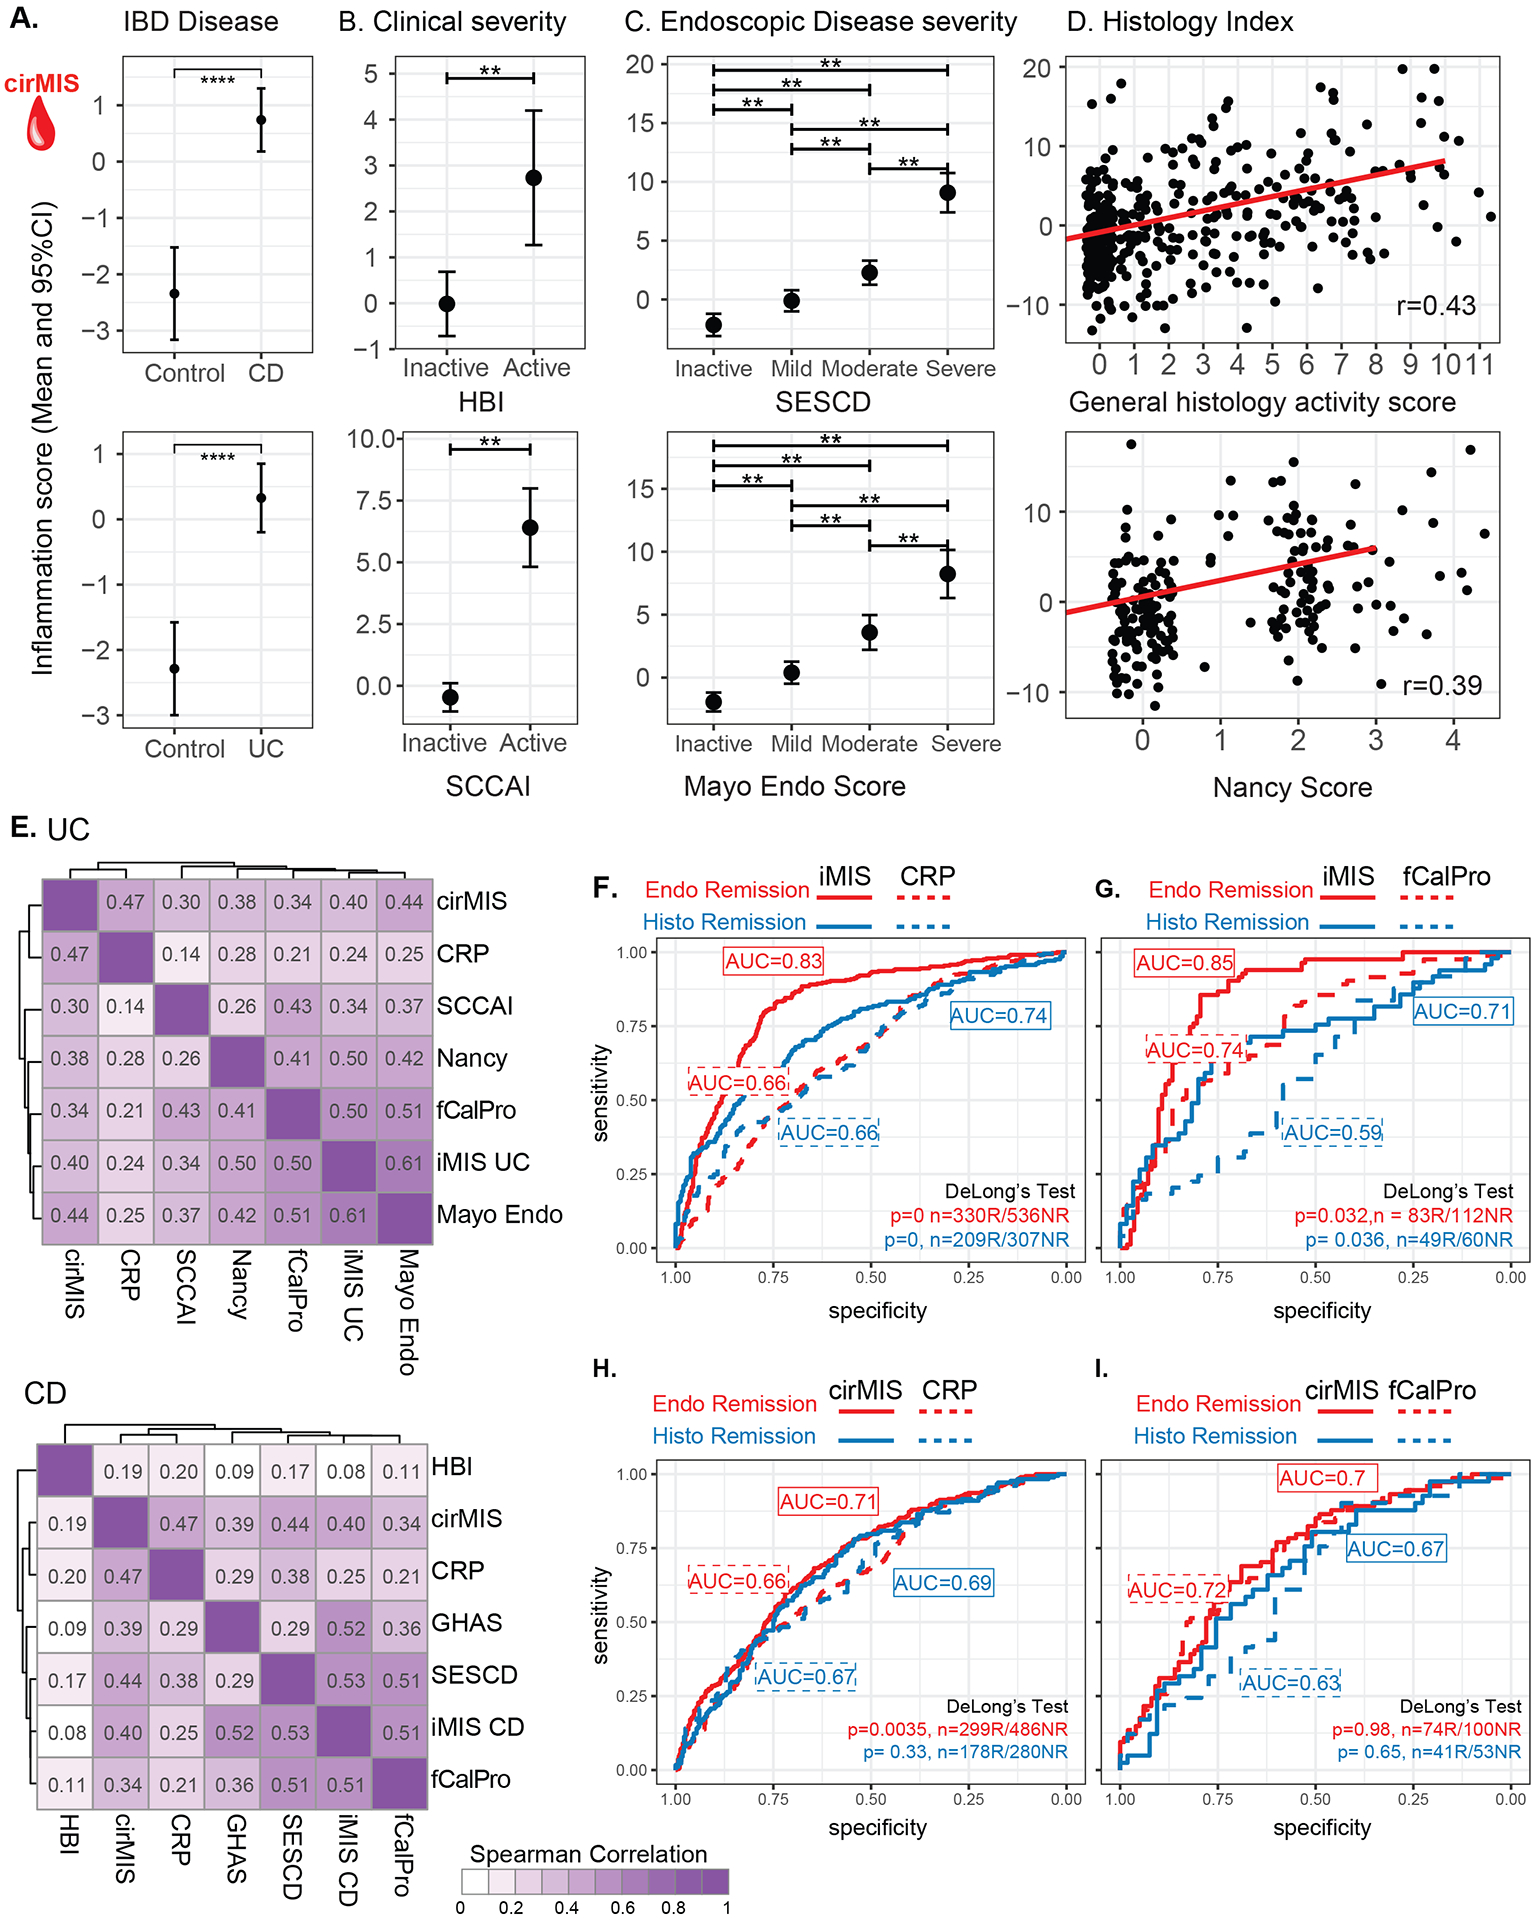
Figure 3.

Association of cirMIS with IBD Disease (A) as well as Clinical (B) Endoscopic (C) and Histological assessements (D). A-C. Estimated marginal mean (EMM) and 95% CI for cirMIS from a mixed-effect model including IBD disease status (A) or clinical disease severity (B) or endoscopic disease severity (C), age, sex and genetic PCs as a fixed-effects. D. Scatter plots representing the distribution of cirMIS across histological scores, maximum GHAS for CD and maximum Nancy score for UC. The red line corresponds to the regression line (Max GHAS (top): cirMIS = −1.756+0.901*GHAS, Pearson r: 0.43; Max Nancy (bottom) cirMIS = −1.21+1.802*Nancy, Pearson r: 0.39). E. Heatmaps showing the Spearman correlations between iMIS and cirMIS with molecular (CRP and fecal calprotectin [fCalPro]), endoscopic (HBI for CD and Mayo for UC), histological (GHAS for CD and Nancy for UC), and clinical markers (SESCD for CD and SCCAI for UC) of UC (upper) and CD (lower). F-I Comparison of iMIS and cirMIS with CRP and fecal calprotectin (fCalPro) to classify endoscopic remission (SESCD<3 in CD patients or Mayo endo score=0 in UC patients) and histological remission (GHAS score=0 in CD patients or Nancy score =0 in UC patients). F-I. Delong’s method was used to compare AUCs. *: p<0.05; **: p<0.01; ***: p<0.001; ****: p<0.0001.
