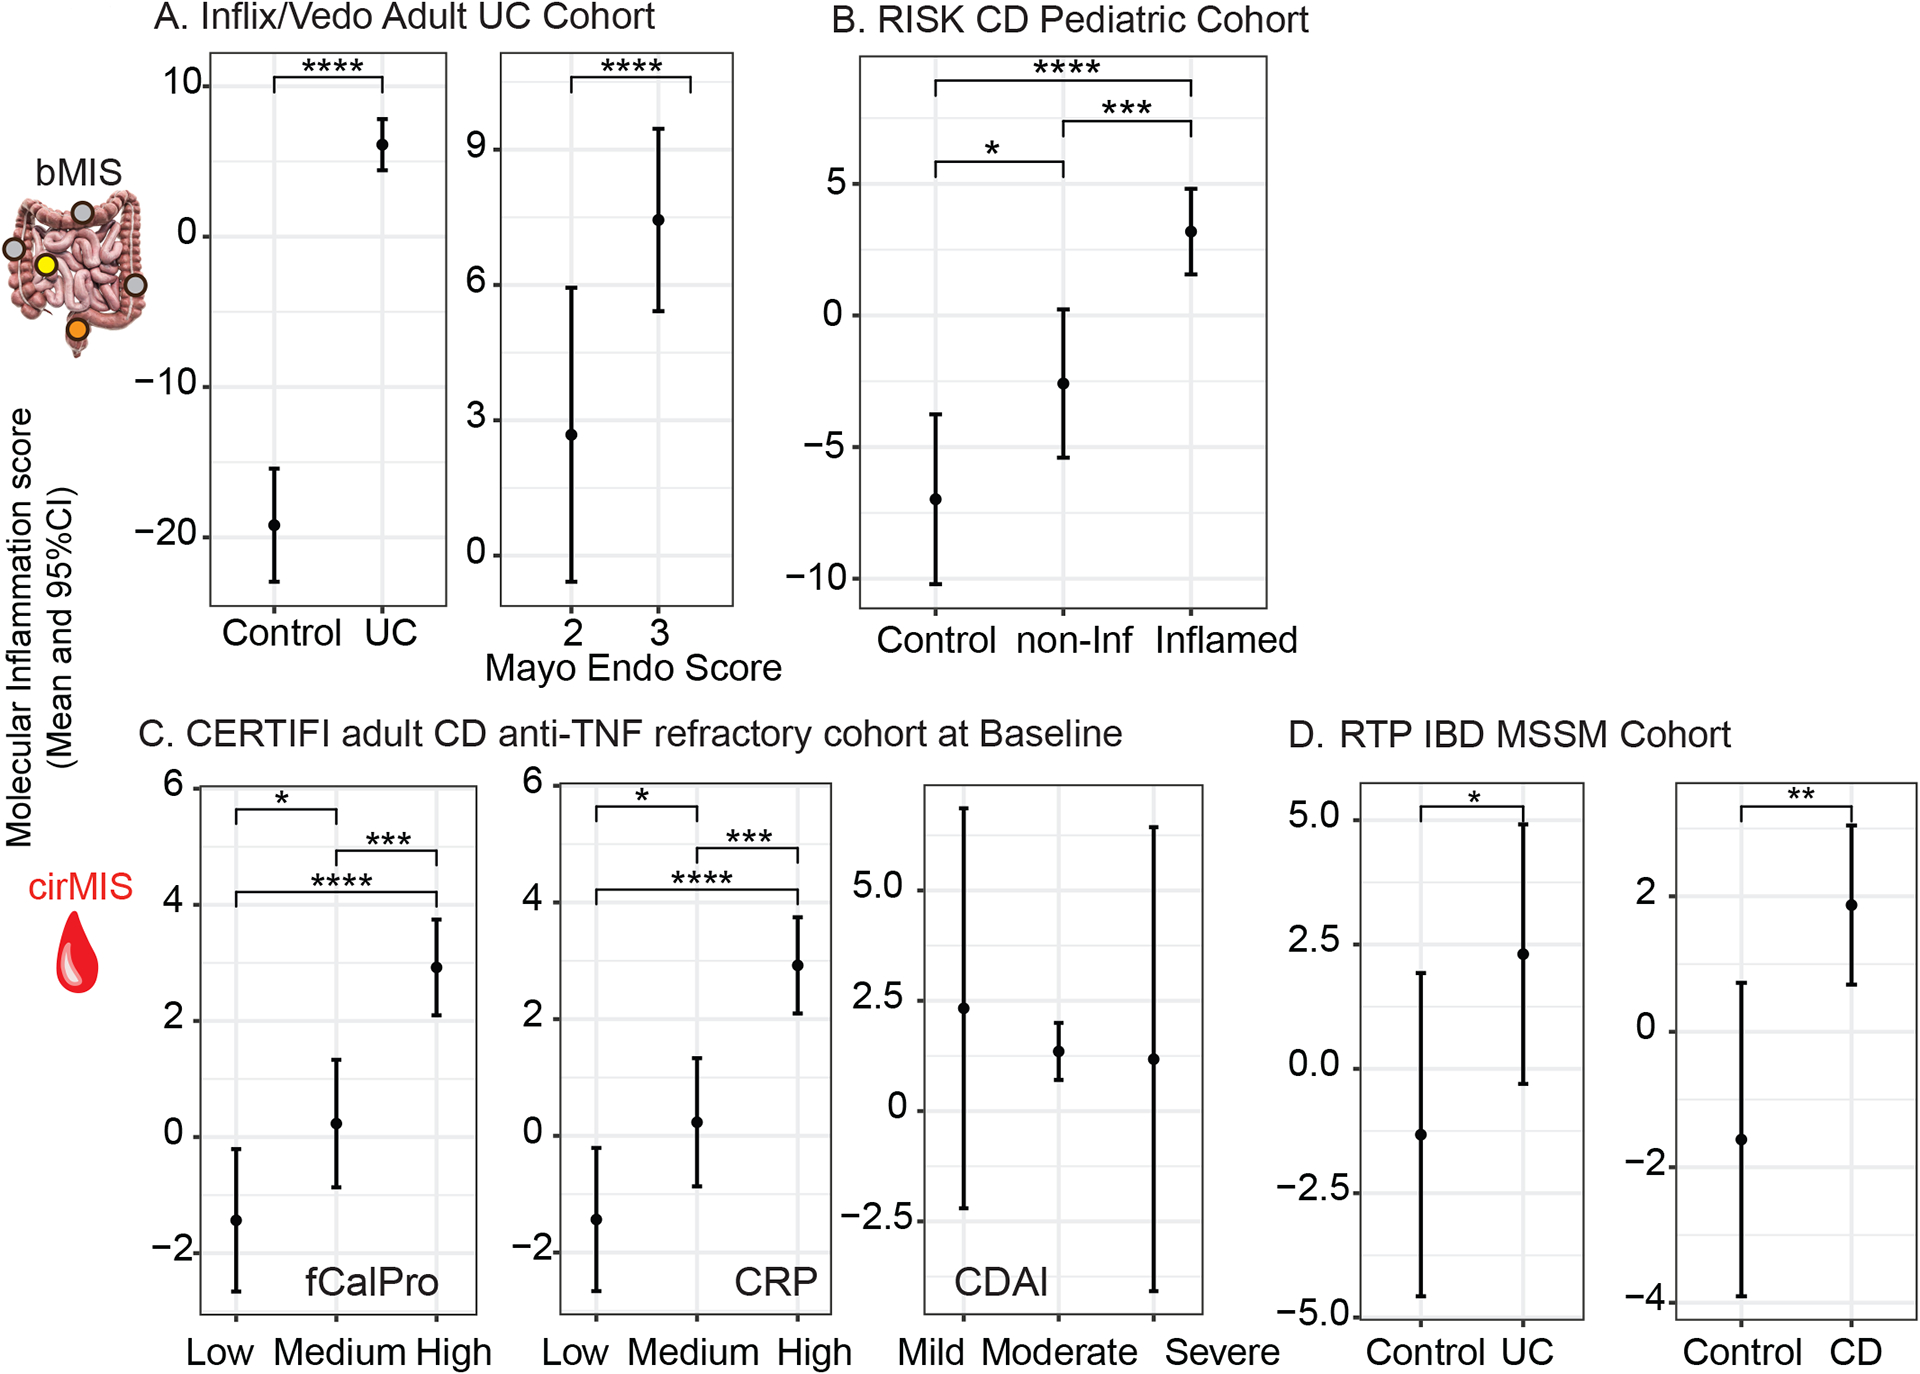
Figure 4.

Validation of bMIS/cirMIS in independent IBD cohorts. A. Line plots showing bMIS_UC can differentiate between control and UC disease status and associate with Mayo endoscopic scores in colonic biopsies from GEMINI-I/LTS trial and anti-TNF UC participants. B. Line plots showing bMIS_CD could differentiate between control, non-inflamed ileum and inflamed ileum biopsies form the RISK pediatric CD Cohort. C. Line plots showing cirMIS_CD associates with fecal calprotectin (fCalPro) and CRP, but not CDAI in the CERTIFI CD cohort. D. Line plots showing cirMIS_UC and cirMIS_CD can differentiate between control and UC or CD disease status in the RTP-IBD MSSM cohort. (A-D) Each plot represents the estimated marginal mean and 95% CI through a linear mixed-effect model on the baseline data. *: p<0.05; **: p<0.01; ***: p<0.001; ****: p<0.0001
