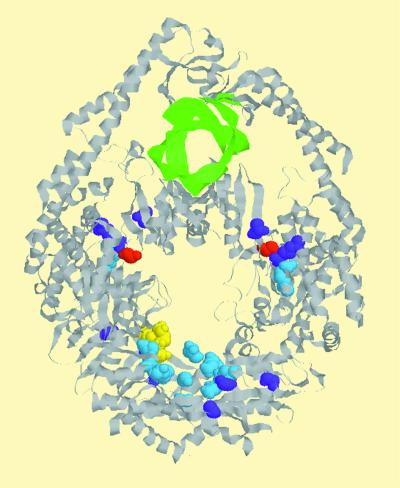
FIG. 1.
The figure was drawn using coordinates kindly provided by T. Sixma (Netherlands Cancer Institute, Amsterdam, The Netherlands) for E. coli MutS bound to DNA containing a T · G mismatch (10). The color scheme is as follows: gray indicates the MutS protein, green ribbons are DNA, and yellow indicates ADP. Residues in which class I mutations lie are shown in light blue, while residues for class II mutations are shown in purple. Mutations in residue 117 can either be class I or II (see the text), and this residue is shown in red.

