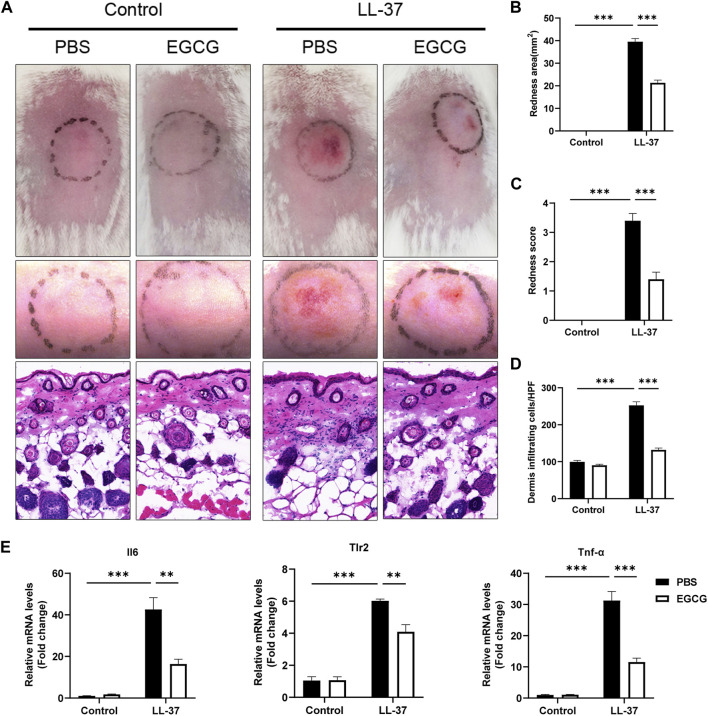
FIGURE 4.
Effect of EGCG on LL37-induced rosacea-like mice. (A) Skin manifestation of different groups. Images were taken 48 h after the first LL37 administration. Scale bar: 50 μm. The severity of inflammatory responses on the skin was assessed in the redness area (B), redness score (C), and quantitative result of HE staining for dermal cellular infiltrates (D). (E) mRNA expression levels of Il6, Tlr2, and TNF-α in skin lesions (n = 5 for each group). All results are representative of at least three independent experiments. Data represent the mean ± SEM. One-way ANOVA with Bonferroni’s post hoc test was used for statistical analyses. **p < 0.01 and ***p < 0.001.

