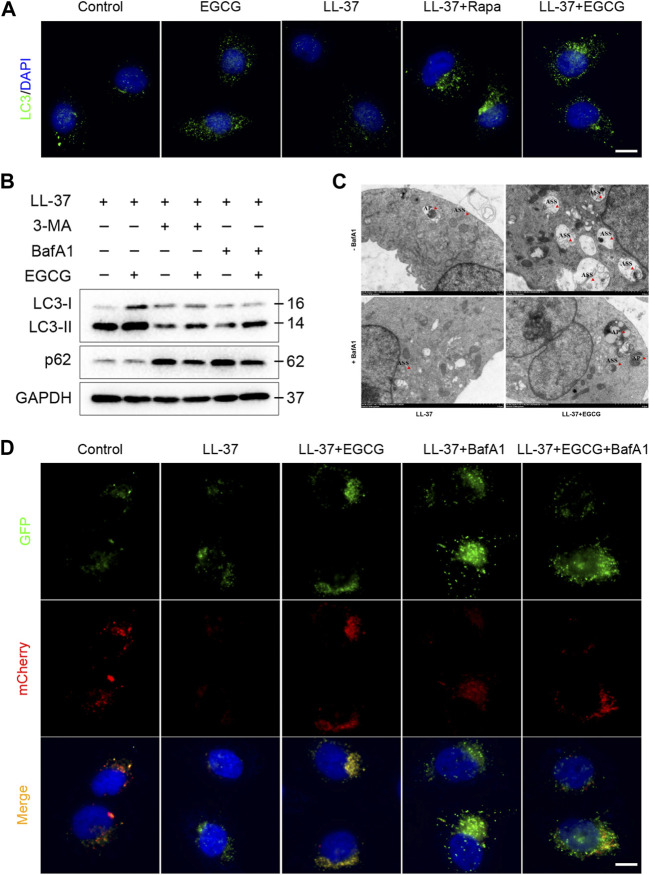
FIGURE 7.
EGCG-induced autophagy in LL-37-induced HaCaT cells. (A) Immunostaining of LC3 in HaCaT keratinocytes treated with LL37 and/or EGCG for 24 h. DAPI staining (blue) indicates nuclear localization. Scale bar: 20 μm. (B) Representative immunoblot analysis of autophagy marker proteins in response to various treatments. (C) Representative TEM images showing the ultrastructure of HaCaT cells incubated with EGCG with or without BafA1 in the presence of LL-37. The red arrowheads indicate the autophagic vacuoles, respectively. AP, autophagosome; ASS, autolysosome. (D) HaCaT cells were transfected with the mCherry-GFP-LC3 plasmid and then treated with EGCG and/or BafA1 in the presence of LL-37 for 24 h. Nuclei were stained with DAPI. Scale bar: 20 μm. All results are representative of at least three independent experiments.

