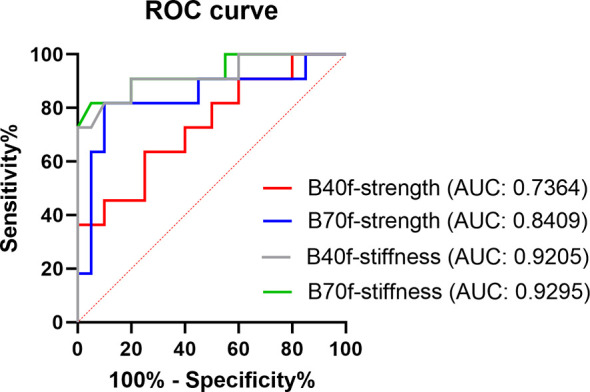
Figure 4.

ROC curve showing the efficacy in distinguishing osteoporosis from the normal bone mass of FE-estimated strength and stiffness based on smooth standard kernel (B40f) and sharp bone kernel (B70f) images.

ROC curve showing the efficacy in distinguishing osteoporosis from the normal bone mass of FE-estimated strength and stiffness based on smooth standard kernel (B40f) and sharp bone kernel (B70f) images.