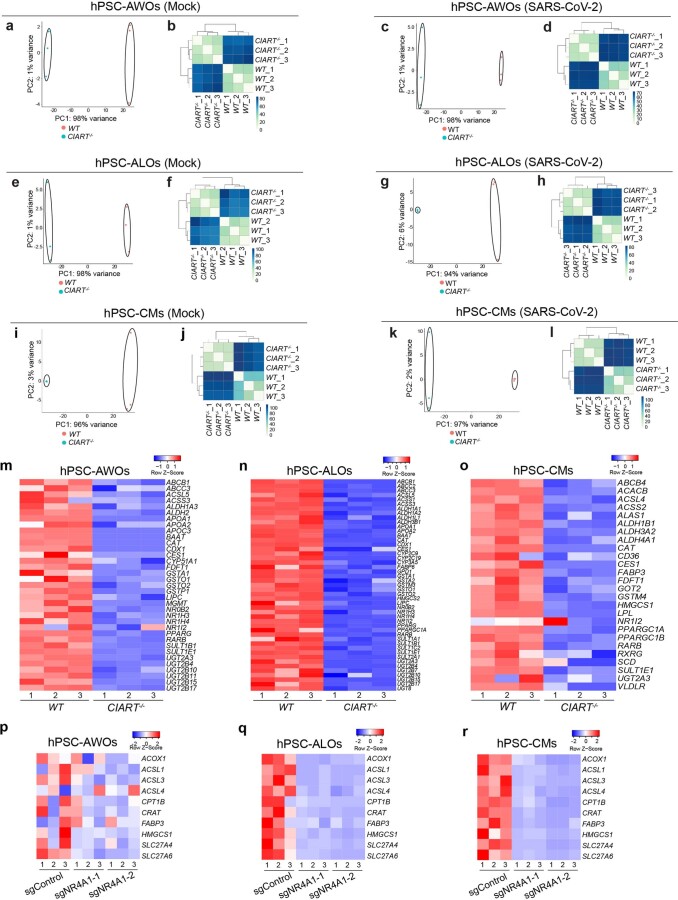
Extended Data Fig. 7. RNA-seq analysis of WT and CIART−/− hPSC-derived AWOs, ALOs and CMs.
a,b, PCA (a) and sample clustering (b) analysis of WT and CIART−/− hPSC-AWOs under mock infection conditions. c,d, PCA (c) and sample clustering (d) analysis of WT and CIART−/− hPSC-AWOs at 24 h.p.i. (m.o.i. = 0.1). e,f, PCA (e) and sample clustering (f) analysis of WT and CIART−/− hPSC-ALOs under mock infection conditions. g,h, PCA (g) and sample clustering (h) analysis of WT and CIART−/− hPSC-ALOs at 24 h.p.i. (m.o.i. = 0.1). i,j, PCA (i) and sample clustering (j) analysis of WT and CIART−/− hPSC-CMs under mock infection conditions. k,l, PCA (k) and sample clustering (l) analysis of WT and CIART−/− hPSC-CMs at 24 h.p.i. (m.o.i. = 0.1). m–o, Heatmaps of RXR pathway-associated genes in WT and CIART−/− hPSC-derived AWOs (m), ALOs (n) and CMs (o) at 24 h.p.i. (m.o.i. = 0.1). n = 3 independent biological replicates. Data are presented as individual biological replicates. p–r, Heatmap of RXR pathway-associated genes in control and sgNR4A1-infected hPSC-derived AWOs (p), ALOs (q) and CMs (r). n = 3 independent biological replicates. Data are presented as individual biological replicates.

