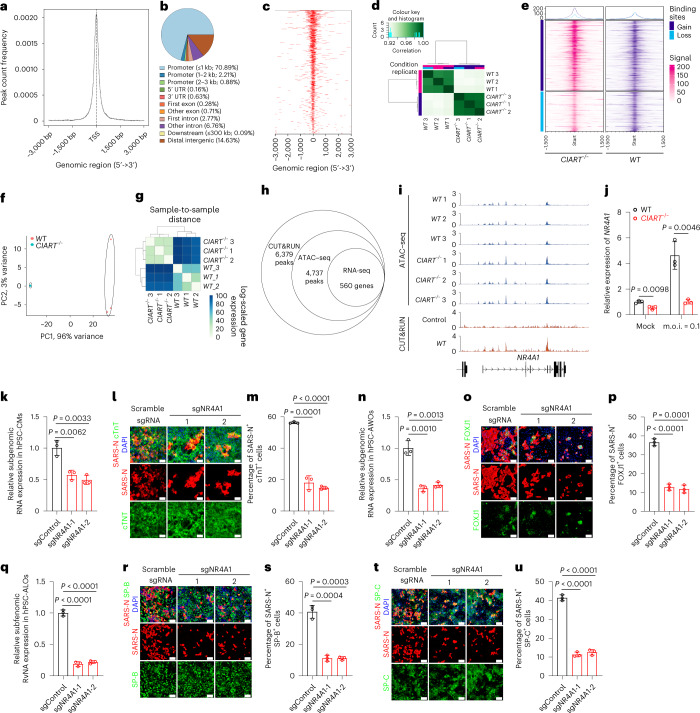
Fig. 3. CIART promotes SARS-CoV-2 infection through NR4A1 regulation.
a, Average profile of CIART CUT&RUN peaks in WT hPSC-CMs around the TSS. b, Distribution of the genomic locations of CUT&RUN peaks in WT hPSC-CMs. c, Profile heatmap showing the distribution of CUT&RUN peaks in WT hPSC-CMs around the TSS. a–c, Data are presented as an integration of all biological replicates; n = 2 independent biological replicates. d, Clustering analysis of ATAC-seq data of WT and CIART−/− hPSC-CMs. e, Profile ATAC-seq heatmap showing the enrichment of gain and loss sites in WT and CIART−/− hPSC-CMs. f,g, RNA-sequencing PCA (f) and sample clustering (g) analysis of WT and CIART−/− hPSC-AWOs under mock infection conditions. d–g, Data are presented as the individual biological replicates (d,f,g) or an integration of all biological replicates (e); n = 3 independent biological replicates. h, Summary of peaks in the CUT&RUN, ATAC-seq and RNA-seq assays. i, Peaks associated with the NR4A1 gene in WT and CIART−/− hPSC-CMs in the ATAC-seq and CUT&RUN assays. Data are presented as individual biological replicates (n = 3 for ATAC-seq) and 2 for CUT&RUN). The schematic below the plots illustrates the exon and intron regions of gene NR4A1 in the genome. j, Expression levels, measured by qRT-PCR, of NR4A1 in WT and CIART−/− hPSC-CMs following mock or SARS-CoV-2 infection (m.o.i. = 0.1). k–m, Relative expression levels of SARS-CoV-2 RNA in hPSC-CMs (k) as well as representative confocal images (l) and calculated percentages (m) of SARS-N+ cells in the cTnT+ subsets of hPSC-CMs expressing scramble sgRNA or sgNR4A1 at 24 h.p.i. (m.o.i. = 0.1). n–p, Relative expression levels of SARS-CoV-2 viral RNA in hPSC-AWOs (n) as well as representative confocal images (o) and calculated percentages (p) of SARS-N+ cells within the FOXJ1+ cell populations of hPSC-AWOs expressing scramble sgRNA or sgNR4A1 at 24 h.p.i. (m.o.i. = 0.1). q–s. Relative expression levels of SARS-CoV-2 RNA in hPSC-ALOs (q) as well as representative confocal images (r) and calculated percentages (s) of SARS-N+ cells within the mature SP-B+ cell populations of hPSC-ALOs expressing scramble sgRNA or sgNR4A1 at 24 h.p.i. (m.o.i. = 0.1). t,u, Representative confocal images (t) and calculated percentages (u) of SARS-N+ cells within mature SP-C+ cell populations of hPSC-ALOs expressing scramble sgRNA or sgNR4A1 at 24 h.p.i. (m.o.i. = 0.1). j–u, Data are presented as the mean ± s.d. (j,k,m,n,p,q,s,u); n = 3 independent biological replicates. P values were calculated by unpaired two-tailed Student’s t-test. Scale bars, 100 μm.

