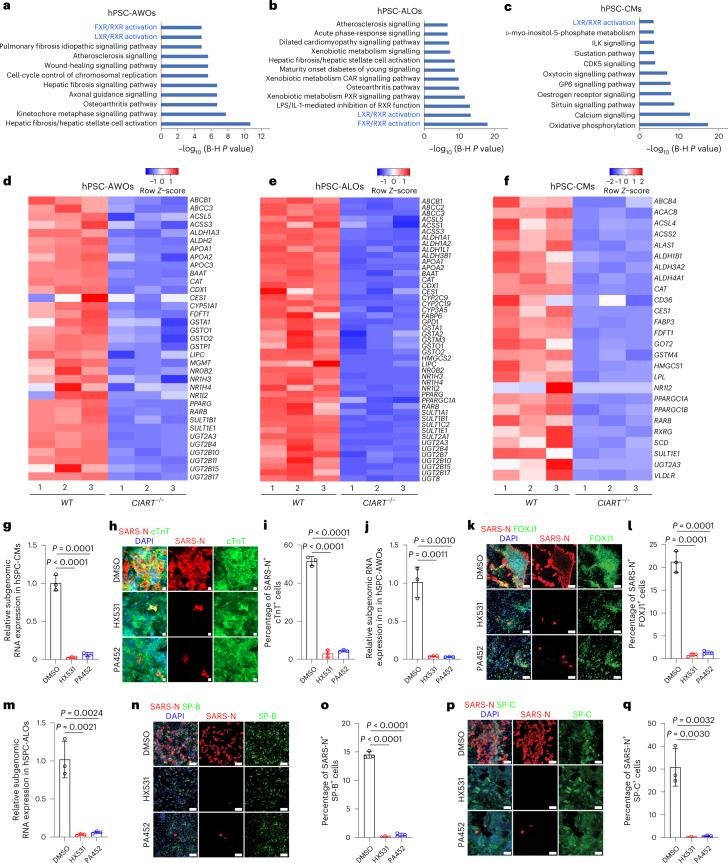
Fig. 4. CIART regulates SARS-CoV-2 infection through the RXR pathway.
a–c, Enriched pathways in CIART−/− hPSC-AWOs (a), hPSC-ALOs (b) and hPSC-CMs (c) relative to their WT counterparts. The B-H p-value was corrected by the Benjamini-Hochberg method. The text in blue highlights that the RXR signaling pathway was enriched in CIART−/− AWOs, ALOs and CMs. d–f, Heatmap of RXR pathway-associated genes comparing WT and CIART−/− hPSC-AWOs (d), hPSC-AWOs (e) and hPSC-CMs (f). g, Relative expression levels of SARS-CoV-2 RNA in hPSC-CMs treated with DMSO, HX531 or PA452 (24 h.p.i.; m.o.i. = 0.3). h,i, Representative confocal images (h) and calculated percentages (i) of SARS-N+ cells in the cTnT+ subsets of hPSC-CMs treated with DMSO, HX531 or PA452 (24 h.p.i.; m.o.i. = 0.3). j, Relative expression levels of SARS-CoV-2 RNA in hPSC-AWOs treated with DMSO, HX531 or PA452 (24 h.p.i.; m.o.i. = 0.3). k,l, Representative confocal images (k) and calculated percentages (l) of SARS-N+ cells within the FOXJ1+ cell populations of hPSC-AWOs treated with DMSO, HX531 or PA452 (24 h.p.i.; m.o.i. = 0.3). m, Relative expression levels of SARS-CoV-2 RNA in hPSC-ALOs treated with DMSO, HX531 or PA452 (24 h.p.i.; m.o.i. = 0.3). n,o, Representative confocal images (n) and calculated percentages (o) of SARS-N+ cells within the mature SP-B+ cell populations of hPSC-ALOs treated with DMSO, HX531 or PA452 (24 h.p.i.; m.o.i. = 0.3). p,q, Representative confocal images (p) and calculated percentages (q) of SARS-N+ cells within the mature SP-C+ cell populations of hPSC-ALOs treated with DMSO, HX531 or PA452 (24 h.p.i.; m.o.i. = 0.3). Data are presented as an integration of all biological replicates (a–c), individual biological replicates (d–f) or the mean ± s.d. (g,i,j,l,m,o,q); n = 3 independent biological replicates. P values were calculated using a paired or an unpaired two-tailed Student’s t-test. Scale bars, 100 μm.

