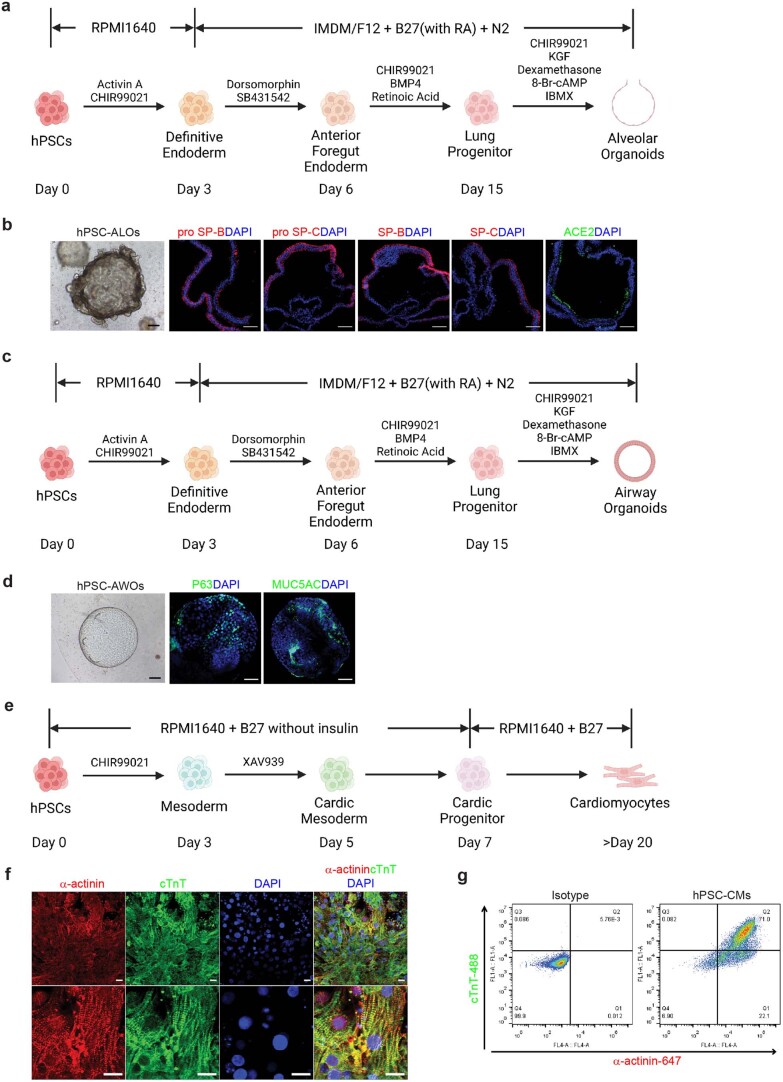
Extended Data Fig. 1. Characterization of hPSC-ALOs, hPSC-AWOs and hPSC-CMs.
a, Scheme of hPSC-ALO differentiation. b, Representative confocal images of day 45 hPSC-ALOs. Scale bar, 100 μm. c, Scheme of hPSC-AWO differentiation. d, Representative confocal images of day 40 hPSC-AWOs. Scale bar, 100 μm. e, Scheme of hPSC-CMs differentiation. f, Representative confocal images of day 30 hPSC-CMs. Scale bar, 100 μm. g, Flow cytometry analysis of α-actinin and cTnT expression in day 30 hPSC-CMs.

