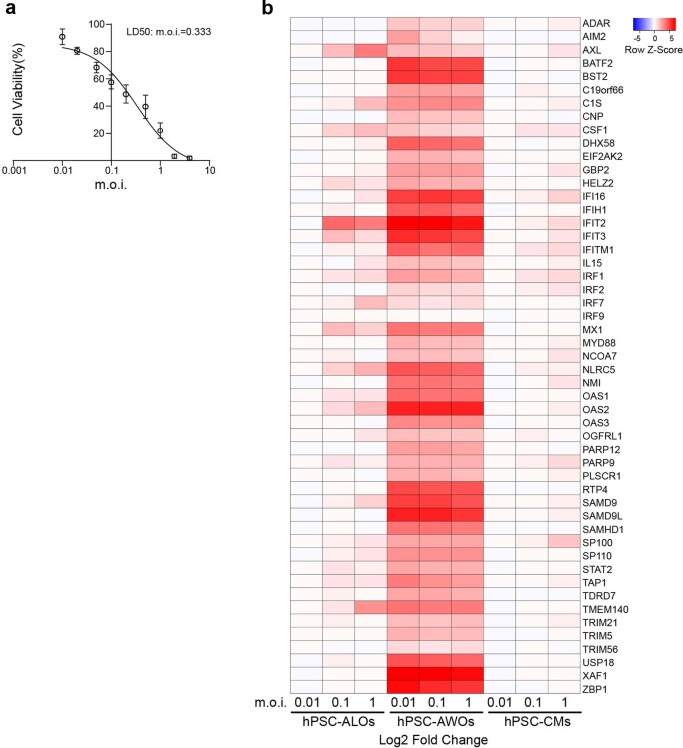
Extended Data Fig. 2. LD50 of hPSC-CMs and heatmap of IFN-1 genes.
a, Cell viability of hPSC-CMs at 48 h.p.i. with SARS-CoV-2 at different m.o.i. LD50, m.o.i. = 0.333. n = 3 independent biological replicates. Data are presented as the mean ± s.d. b, Heatmap showing induction of genes involved in the type 1 IFN signalling pathway in SARS-CoV-2-infected hPSC-ALOs, -AWOs and -CMs (m.o.i. = 0.01, 0.1 and 1). n = 3 independent biological replicates. Data are presented as an integration of all biological replicates.

