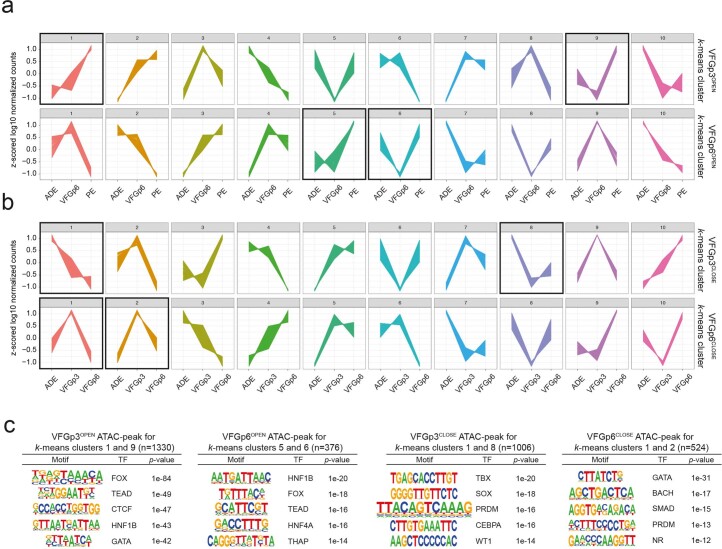
Extended Data Fig. 8. k-means clustering and motif analysis for VFG expansion dependent ATAC-clusters.
a-b, k-means clustering of genes within 200Kb of peaks in ATAC clusters as defined in Fig. 4a (VFGp3OPEN, VFGp6OPEN, VFGp3CLOSE, and VFGp3CLOSE). Z-scored log10 normalized gene expression of ADE, VFGp6, and PE samples (a); and of ADE, VFGp3, and VFGp6 samples (b) were plotted for VFGOPEN and VFGCLOSE clustered genes respectively (n = 10). c, De novo motif search was made using Homer findMotifsGenome and searched within ±200 bp of peak center for genes mapped to the vicinity of VFGp3OPEN (k-means clusters 1 and 9, n = 1330), VFGp6OPEN (k-means clusters 5 and 6, n = 376), VFGp3CLOSE (k-means clusters 1 and 8, n = 1006), and VFGp6CLOSE (k-means clusters 1 and 2, n = 524).

