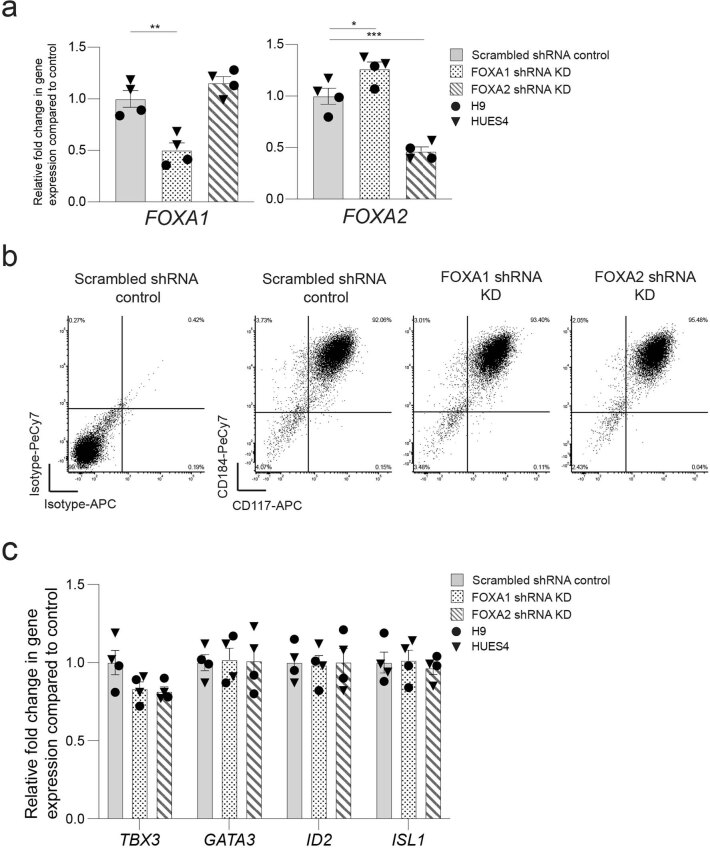
Extended Data Fig. 9. Characterization of FOXA1 and FOXA2 shRNA KD VFG cells.
a, Expression analysis in FOXA1 and FOXA2 shRNA KD cells (described in Fig. 6b) by RT-qPCR. Expression of FOXA1 (left) and FOXA2 (right) in the KD cells was normalized relative to the expression in scrambled shRNA controls. Triangles and circles mark cells derived from HUES4 and H9 ESCs respectively. Data are represented as mean ± SEM (N = 4 independent experiments). *P < 0.05, **P < 0.01, ***P < 0.001 (unpaired two-tailed t-test). Comparisons without an indicated P value are not significant. b, Representative flow cytometry density plots showing CD184 (CXCR4) and CD117 (KIT) expression in scrambled shRNA control, FOXA1, and FOXA2 shRNA KD VFG cells. Bottom left quadrant indicates gating based on isotype staining controls in scrambled shRNA control VFG cells. Flow Cytometry plots represent three independent experiments. c, Expression analysis in FOXA1 and FOXA2 shRNA KD cells (described in Fig. 6b) by RT-qPCR. Expression of VFG markers TBX3, GATA3, ID2, and ISL1 in the KD cells was normalized relative to that in scrambled shRNA controls. Triangles and circles mark cells derived from HUES4 and H9 ESCs respectively. Data are represented as mean ± SEM (N = 4 independent experiments). No statistical difference (unpaired two-tailed t-test) was found in the comparisons.

