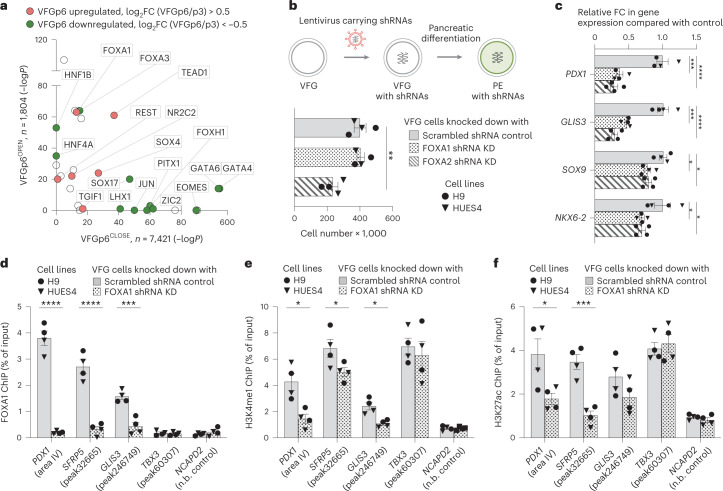
Fig. 6. FOXA proteins are required for VFG enhancer priming towards pancreatic differentiation.
a, TF motif enrichment in VFGp6OPEN (n = 1,804) and VFGp6CLOSE (n = 7,421) ATAC clusters; n, number of peaks analysed. P values were derived from hypergeometric enrichment using HOMER default background. Candidate factors with P > 1 × 10⁻¹⁰ for both clusters were not included in the plot. Gene expression of the candidate factors that upregulated (red) or downregulated (green) from VFGp3 to VFGp6 (log2FC > 0.5, P < 0.05) are labelled. b, Top: schematic of FOXA1 and FOXA2 shRNA KD VFG cells and their PE differentiation. Bottom: histogram for proliferation assay (cell counts) for FOXA1 and FOXA2 shRNA KD and scrambled shRNA control VFG cells. Data are represented as mean ± s.e.m.; N = 4 independent experiments. Statistical analysis was performed between KDs and control VFG cells (**P < 0.01, unpaired two-tailed t-test; only significant comparisons are shown). c, Differentiation of FOXA1 and FOXA2 shRNA KD and scrambled control VFG cells to PE, with legend shown in b. Relative FC in mRNA of pancreatic genes (PDX1, GLIS3, SOX9 and NKX6-2) was assayed by RT–qPCR. Expression is normalized to ACTB. Data are represented as mean ± s.e.m.; N = 4 independent experiments. *P < 0.05, ***P < 0.001, ****P < 0.0001 (one-way ANOVA Dunnett’s multiple comparison test compared with control). d–f, FOXA1 binding (d), H3K4me1 (e) and H3K27ac (f) enrichment by ChIP–qPCR at enhancer regions of PDX1 (area IV), GLIS3 (peak246749) and TBX3 (peak60307) in FOXA1 shRNA KD VFG and scrambled control cell lines. An intragenic region of NCAPD2 served as a non-bound (n.b.) control. Data are represented as mean ± s.e.m.; N = 4 independent experiments. Statistical analysis was performed between the KD and control VFG cells. *P < 0.05, ***P < 0.001, ****P < 0.0001, (unpaired one-tailed t-test; only significant comparisons are shown).

