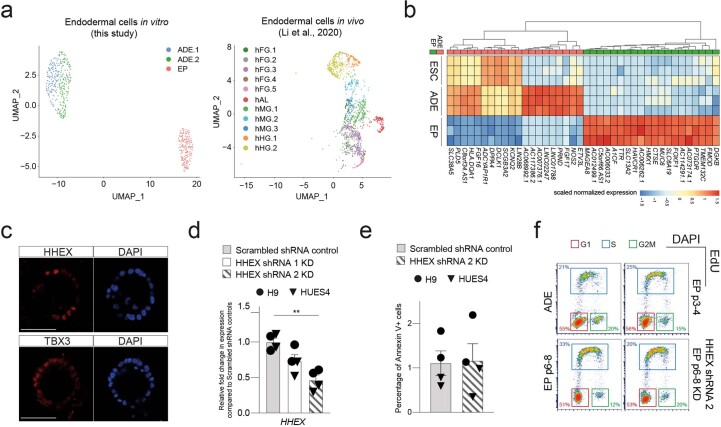
Extended Data Fig. 1. Ventral foregut identity of expanding endodermal progenitors.
a, Left: UMAP visualization of single cells from the transient ADE (ADE.1 and ADE.2) and EP passage 6 samples. Right: UMAP visualization of single cells from different endodermal populations from early human embryos reported in Li et al.20. b, Heatmap illustrating gene expression in H9-derived ESC, ADE, and EP cells (N = 3 independent experiments) from bulk RNA-seq dataset. Scaled normalized expression of the top 20 differentially expressed genes for each condition (ADE vs EP) is shown. c, Representative immunostaining of hAL markers, HHEX and TBX3, in EP passage 6 cells derived from H9 ESC cells. Images represent three independent experiments. Scale bar = 50 µm. d, Expression analysis in HHEX shRNA KD cells (set 1 and set 2) and scrambled shRNA control by RT-qPCR. Relative fold change in mRNA of HHEX gene in KDs and control EP/VFG cells was assayed by RT-qPCR. Expression is normalized to ACTB. Circles and triangles mark cells derived from H9 and HUES4 WT ESCs respectively. Data are represented as mean ± SEM (N = 4 independent experiments). Statistical analysis (**P < 0.01, unpaired two-tailed t-test) was performed between KD and control EP/VFG cells. Comparisons without an indicated P value are not significant. e, Apoptosis assay in HHEX shRNA (set2) KD and scrambled shRNA control EP/VFG. Bar plot showing percentage of Annexin V + cells for each assay. Circles and triangles mark cells derived from H9 and HUES4 WT ESCs respectively. Data are represented as mean ± SEM (N = 4 independent experiments). No statistical difference (unpaired two-tailed t-test) was found between HHEX shRNA KD and scrambled shRNA control. f, Representative flow cytometry plots used to analyze the cell cycle in transient ADE, early EP/VFG (p3-4), expanding EP/VFG (p6-8) and HHEX depleted EP/VFG (p6-8). Cells were stained with EdU and DAPI. Cells in G1 (red), S (blue), and G2M (green) were gated and percentages of each fraction shown. Flow Cytometry plots represent three independent experiments.

