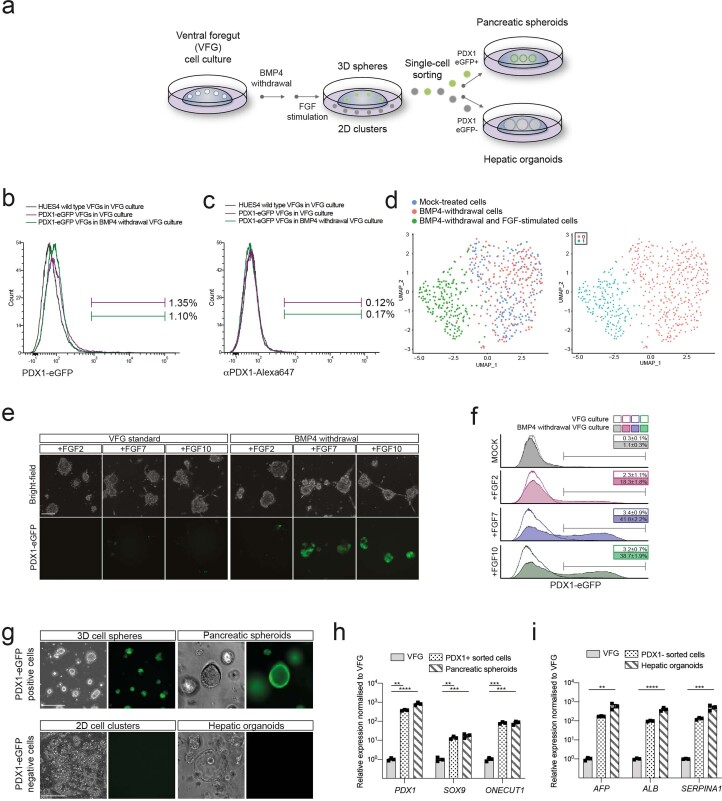
Extended Data Fig. 2. Human VFG cultures can be readily transformed to either pancreatic or hepatic lineages.
a, Schematic representation showing the conversion of VFG culture to pancreatic and hepatic expansion. The figure illustrates the generation of PDX1−eGFP positive (PDX1+) and negative (PDX1−) cells from VFG culture after BMP4 withdrawal and subsequent stimulation with FGF. b-c, Flow cytometry of eGFP expression (b) or intracellular PDX1 (c) for HUES4 wild type (grey), PDX1−eGFP reporter (purple) in VFG culture, and the reporter following BMP4 withdrawal (green). Fractions of eGFP+ or PDX1+ were gated and percentages are shown. Flow Cytometry plot represents three independent experiments. d, Left: UMAP visualization of 526 cells isolated from mock-treated VFG (blue), VFG cells grown in the absence of BMP4 (red), and transient pancreatic induction by FGF2 simulation (green). Right: UMAP visualization of Seurat clustering from the samples described on the left. e, Representative bright-field (top) and fluorescent (bottom) images for the PDX1-eGFP reporter VFGs (left) or following BMP4 withdrawal (right), and then treated with FGF2, FGF7, or FGF10. Images represent three independent experiments. Scale bar = 50 μm. f, Flow cytometry of eGFP expression for the conditions described in (e), including mock-treated cells. Percentages of PDX1+ cells were shown in the rectangle boxes of each histogram. Flow Cytometry plots represent three independent experiments. g, PDX1+ cells form 3D spheres and expand as pancreatic spheroids (Top). PDX1−cells form 2D clusters and expand as hepatic organoids (bottom). Images represent three independent experiments. Scale bar = 50 µm. h-i, Relative fold change in mRNA of pancreatic markers (PDX1, SOX9, and ONTCUT1) (h) and hepatic markers (AFP, ALB, and SERPINA1) (i) in the VFGs and VFG-derived cell types (as described in a and g). Expression is normalized with ACTB. Data are represented as mean ± SEM (N = 3 independent experiments). **P < 0.01, ***P < 0.001, ****P < 0.0001 (one-way ANOVA Dunnett’s multiple comparison test compared with VFG).

