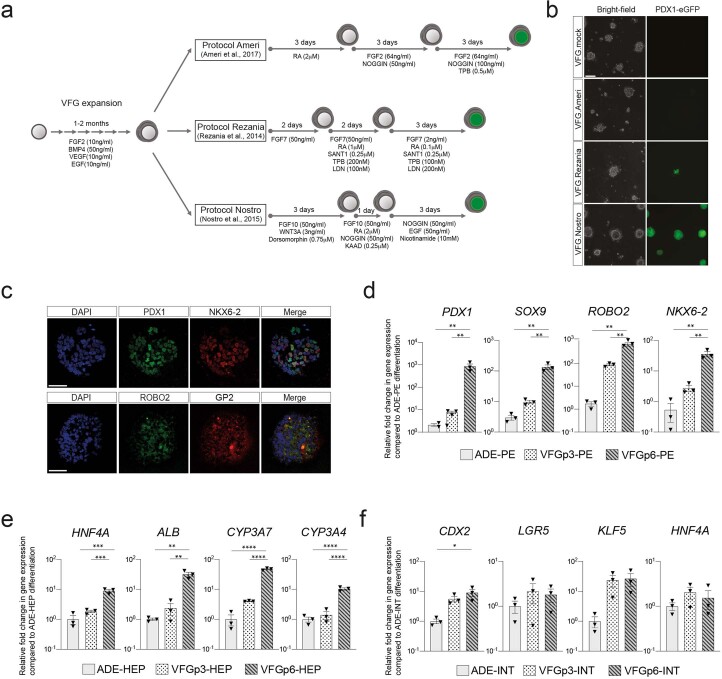
Extended Data Fig. 3. in vitro differentiation of VFG culture towards pancreatic, hepatic, and intestinal endoderm.
a, Schematic diagram for stepwise pancreatic differentiation with protocols from Ameri et al.22, Rezania et al.12 and Nostro et al.10 from established VFG culture. b, Representative bright-field (left) and fluorescent (right) images for the PDX1-eGFP reporter VFGs differentiated with protocols indicated. Images represent three independent experiments. Scale bar = 50 μm. c, Representative immunostaining of PDX1 (green) and NKX6-2 (red) in the top row; ROBO2 (green) GP2 (red) in the bottom row, including DAPI (blue) for p6 VFG cells differentiated with protocol from Nostro et al.10. Images represent three independent experiments. Scale bar = 50 μm. d, Bar plot showing relative fold change in mRNA of pancreatic markers PDX1, SOX9, ROBO2, and NKX6-2 in pancreatic differentiation from ADE and VFG at p3 and p6 cells. Data are represented as mean ± SEM (N = 3 independent experiments). **P < 0.01, (one-way ANOVA Tukey’s multiple comparison test, only significant comparisons are shown). e, Bar plot showing relative fold change in mRNA of hepatic markers HNF4A, ALB, CYP3A7, and CYP3A4 in hepatic differentiation from ADE and VFG at p3 and p6 cells. Data are represented as mean ± SEM (N = 3 independent experiments). **P < 0.01, ***P < 0.001, ****P < 0.0001 (one-way ANOVA Tukey’s multiple comparison test, only significant comparisons are shown). f, Bar plot showing relative fold change in mRNA of intestinal markers CDX2, LGR5, KLF5, and HNF4A in hepatic differentiation from ADE and VFG at p3 and p6 cells. Data are represented as mean ± SEM (N = 3 independent experiments). *P < 0.05 (one-way ANOVA Tukey’s multiple comparison test, only significant comparisons are shown). Comparisons without an indicated P value are not significant.

