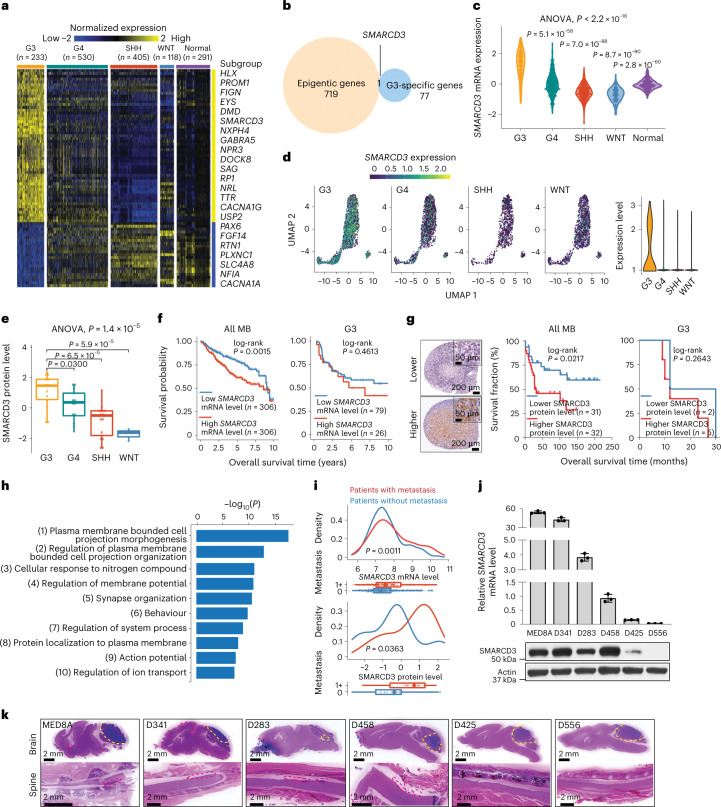
Fig. 1. High levels of SMARCD3 expression in G3 correlate with MB metastasis.
a, A heatmap of gene expression in the four MB subgroups (G3, group 4 (G4), SHH and WNT) and in unaffected (normal) tissues. Twofold change; false discovery rate (FDR) < 0.05. b, Venn diagram showing the overlapping SMARCD3 expression between G3-associated genes and epigenetic genes. c, Violin plot showing SMARCD3 mRNA expression using transcriptomics data from patients with MB. ANOVA, analysis of variance. d, Uniform manifold approximation and projection (UMAP) visualization (left) and violin plot (right) showing SMARCD3 mRNA expression based on scRNA-seq data from 25 patients with MB. e, Boxplot showing levels of SMARCD3 expression (nG3 = 14, nG4 = 13, nSHH = 15, nWNT = 3). f, Kaplan–Meier survival curve of patients comparing all MB subgroups (left) and G3 only (right) based on SMARCD3 mRNA expression level. g, Left, representative images of IHC staining for SMARCD3 levels in MB tissue microarrays. Right, log-rank test for survival fraction of patients comparing all MB subgroups and G3 only based on SMARCD3 level. h, Top ten biological pathways of the SMARCD3-associated genes in MB by GO analysis. i, Density plots (top) and boxplots (bottom) showing the association between metastasis status (0, no metastasis; 1+, metastasis at diagnosis) and SMARCD3 mRNA (n0 = 397, n1+ = 176) and protein (n0 = 23, n1+ = 20) expression levels in primary MB samples. j, RT–qPCR (top) and immunoblotting (bottom) analyses showing SMARCD3 mRNA (n = 3) and protein levels in six G3 MB cell lines. k, Representative haematoxylin and eosin (H&E) images showing primary tumours (yellow dashed lines) and brain and spinal metastatic tumours (red dashed lines) in six orthotopic xenograft models derived from G3 MB cell lines. Images are representative of three independent mice, with similar results obtained (k). Each dot represents one bulk sample (c,e,i) or one cell (d). n represents the number of human patients (a,c,e,f,g,i) or biologically independent samples (j). Data are presented as the mean ± s.d. P values were calculated using two-tailed Welch’s t-test with FDR correction (c,e,i) or two-tailed accumulative hypergeometric distribution (h).

