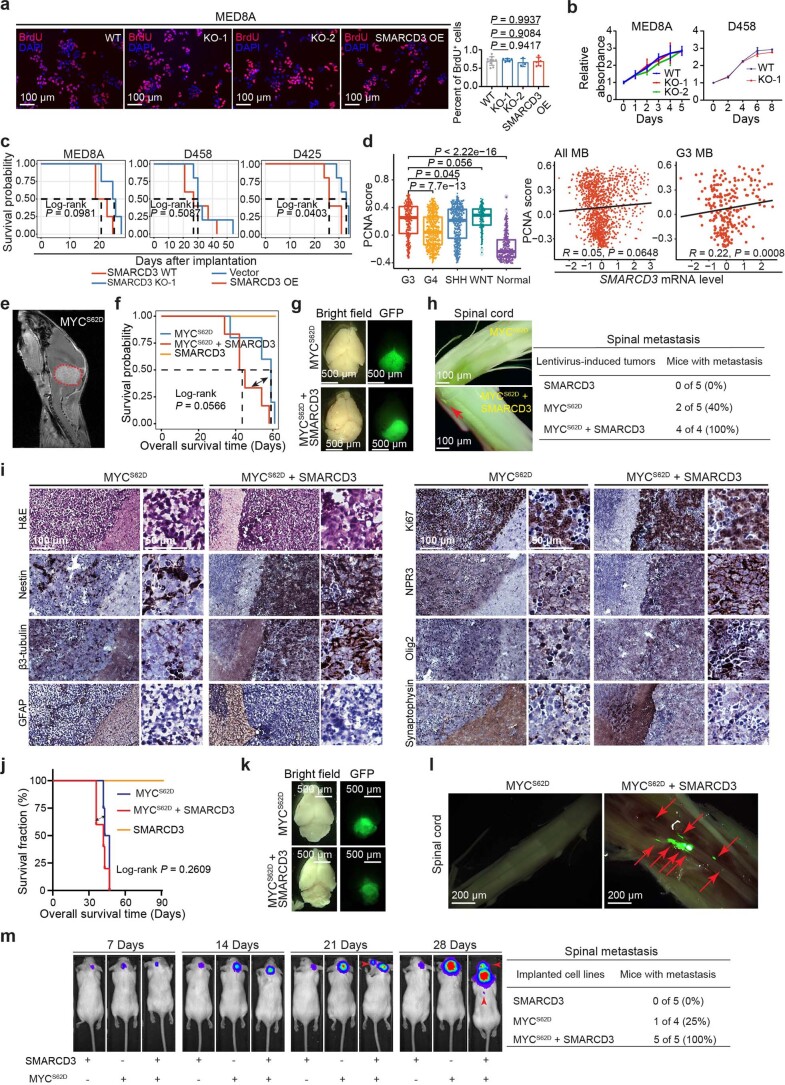
Extended Data Fig. 3. SMARCD3 influences tumor metastasis but not tumor development and growth.
a, IF images and quantification of bromodeoxyuridine (BrdU) in MED8A cells with SMARCD3 WT (n = 10), KO (nKO-1 = 5, nKO-2 = 3), and OE (n = 6). b, Cell proliferation (MTS assay) of MED8A (n = 9) and D458 (n = 3) with SMARCD3 WT vs KO. c, Kaplan-Meier survival of SCID mice bearing indicated tumor cells. d, PCNA signature score levels in G3, G4, SHH, WNT, and normal bulk samples (boxplot); and correlations with SMARCD3 mRNA expression (scatterplots) in all MBs (n = 1, 280) and G3 (n = 233). e, A MRI image of the cerebellar tumor induced by lentivirus carrying MYCS62D in the C57BL/6 J mouse. f, Kaplan-Meier survival of C57BL/6 J mice intracranially infected by lentivirus-mediated indicated gene expression. g, Representative bright-field and fluorescence images of the mouse brains bearing indicated tumors. h, The fluorescence images and pie charts showing the spinal cords from mice bearing indicated tumors. i, H&E and IHC images showing histopathological assessment of MYCS62D- and MYCS62D + SMARCD3-induced tumors for the indicated marker expression. j, Kaplan-Meier survival of SCID mice intracranially implanted by hcNSCs expressing indicated genes. k, Representative bright-field and fluorescence images of the SCID mouse brains bearing indicated tumors. Representative fluorescence images of the spinal cords (l) or luminescence images/pie charts showing spinal metastasis (m) from SCID mice bearing indicated tumors. The n number represents the biologically independent samples (a, b) or patient samples (d), and data are presented as the mean ± s.d. (a, b). P and R values were calculated using one-way ANOVA with Dunnett’s multiple comparison test (a), or two-tailed Welch’s t-test with FDR correction (boxplot in d), two-tailed Spearman’s rank correlation analysis (scatterplots in d), and log-rank test (f, j). The representative images from 4 independent mice were repeated with similar results (g, h, i, k, l).

