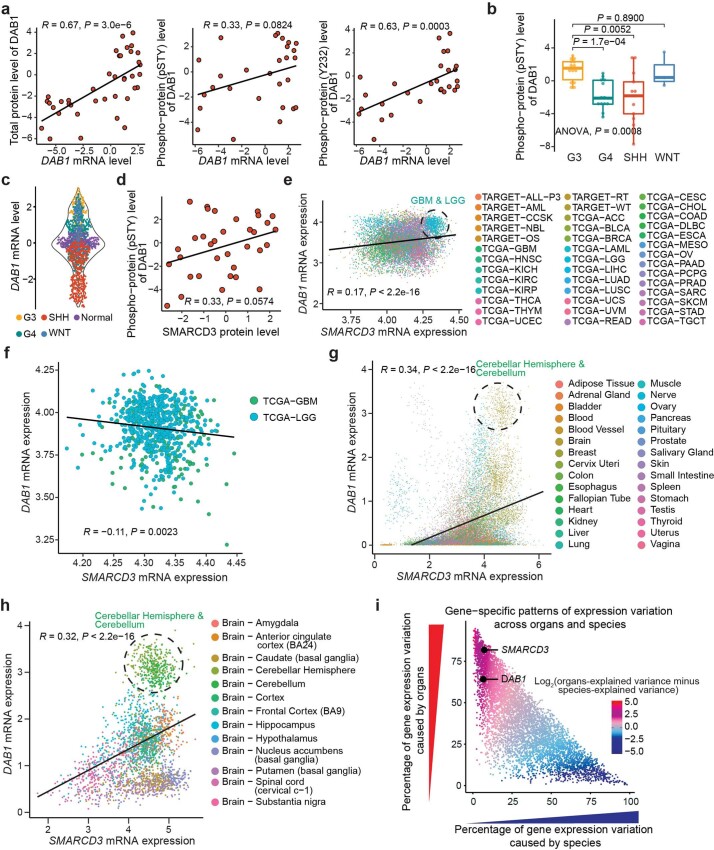
Extended Data Fig. 4. The association between SMARCD3 and DAB1 is evolutionarily conserved in the cerebellum.
a, Scatterplots showing the correlation of expression levels between DAB1 mRNA and the total DAB1 protein, phospho-DAB1 (pSTY), or phospho-DAB1 (Y232) in all MB tumors (n = 45). b, Boxplot showing the levels of phospho-DAB1 (pSTY) protein expression in the MB proteomics dataset (nG3 = 14, nG4 = 13, nSHH = 13, and nWNT = 3). c, Violin plot showing DAB1 mRNA expression in four MB subgroups and normal cerebellum. d, Scatterplot showing the correlation between SMARCD3 protein expression levels and the phospho-DAB1 (pSTY) protein levels in all MBs. e, f, Scatterplot showing the correlation between SMARCD3 and DAB1 mRNA expression levels in all cancer types and gliomas using the datasets from the TARGET and TCGA projects. The dashed line outlines the glioblastomas and low-grade gliomas. g, Scatterplot showing the correlations between SMARCD3 mRNA expression levels and DAB1 mRNA expression levels in normal tissues using the datasets from the GTEx projects. h, Scatterplot showing the correlations between SMARCD3 and DAB1 mRNA expression levels in brain tissues only. Dashed line circles highlight the tissues from the cerebellum and cerebellar hemisphere (g, h). i, Percentage of gene expression variance explained by species and by organs. Data from the reference25 were used for analysis, including six organs (brain, cerebellum, heart, kidney, liver, and testis) in seven vertebrate species (chicken, chimpanzee, human, mouse, opossum, platypus, and rhesus). Each color dot represents one tumor sample (a-f), a normal tissue sample (g-h), or a gene (i). The red dot is explained mostly by organ differences, while the blue dot is by species differences (i). P and R values were calculated using two-tailed Welch’s t-test with FDR correction (b) and/or two-tailed Spearman’s rank correlation analysis (a, d, e, f, g, h).

