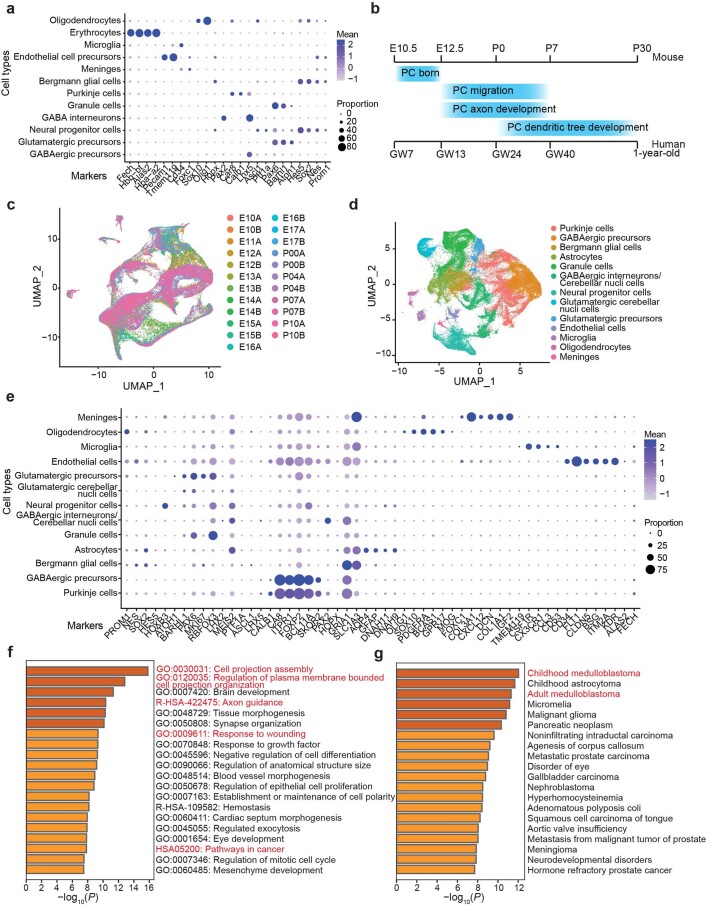
Extended Data Fig. 5. Characterization of SMARCD3 expression during human and mouse cerebellar development using scRNAseq datasets.
a, Dotplot showing the expression of each selected marker gene per cell type in mouse cerebellum. b, The schematic diagram shows the timeline of Purkinje cell development in both humans and mice. c, UMAP visualization of the developing mouse cerebellum. d, UMAP visualization and marker-based annotation of cell types from the developing human cerebellum. e, Dotplot showing the expression of each selected marker gene per cell type in the human cerebellum. f, The top 20 biological pathways are enriched by Gene-ontology analysis of the SMARCD3-positively correlated genes in the human cerebellum. g, The top 20 diseases are enriched in DisGeNET by analyzing the SMARCD3-positively correlated genes in the human cerebellum. Each dot represents one cell (c, d). Dots with the same color come from the same mouse cerebellum (c) or the same cell type (e). P value from the multiple Fisher test is corrected using two-tailed Benjamini-Hochberg method (f, g).

